Descriptive Statistics vs Inferential Statistics
Summary
TLDRThis script introduces the field of statistics, distinguishing between descriptive and inferential statistics. Descriptive statistics involve organizing and summarizing data through graphs like bar graphs, histograms, and pie charts, and numerical measures like mean, median, mode, range, variance, and standard deviation. Inferential statistics use sample data to make inferences about a population, with examples given for estimating preferences within a city's population. The script also touches on confidence intervals and the impact of sample size on the accuracy of population predictions.
Takeaways
- 📊 Statistics is the science of collecting, analyzing, interpreting, and presenting data.
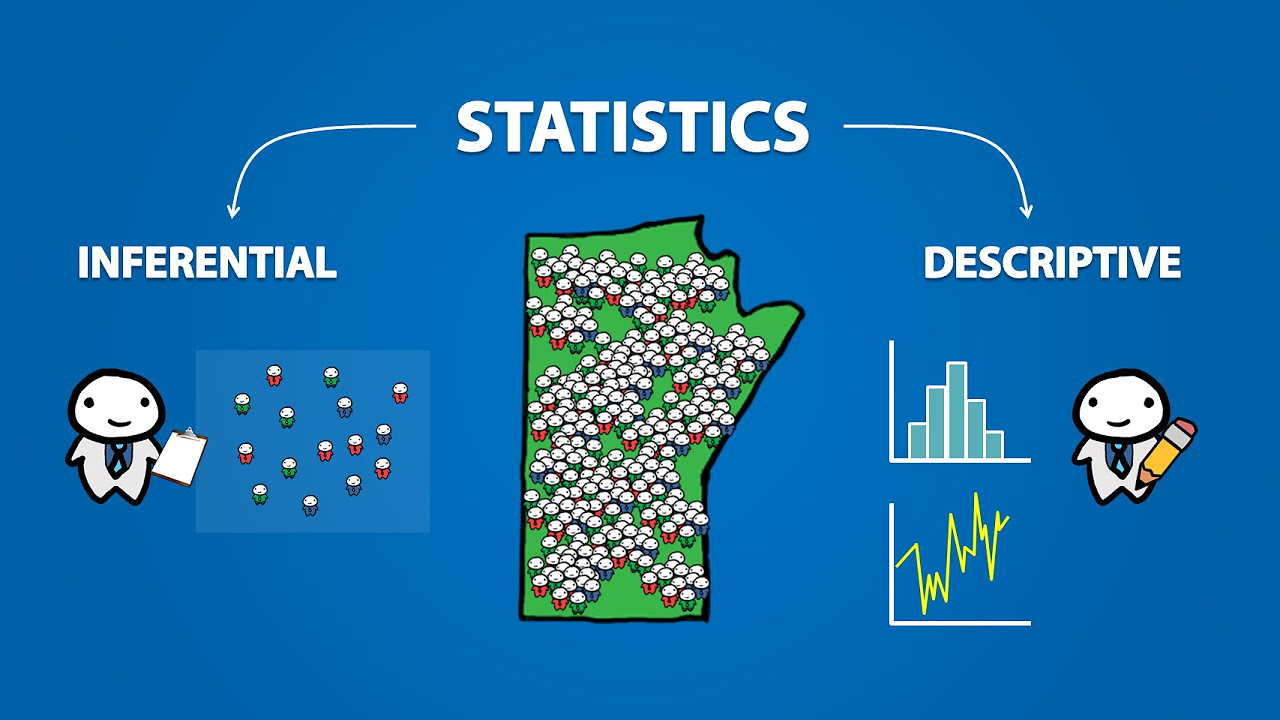
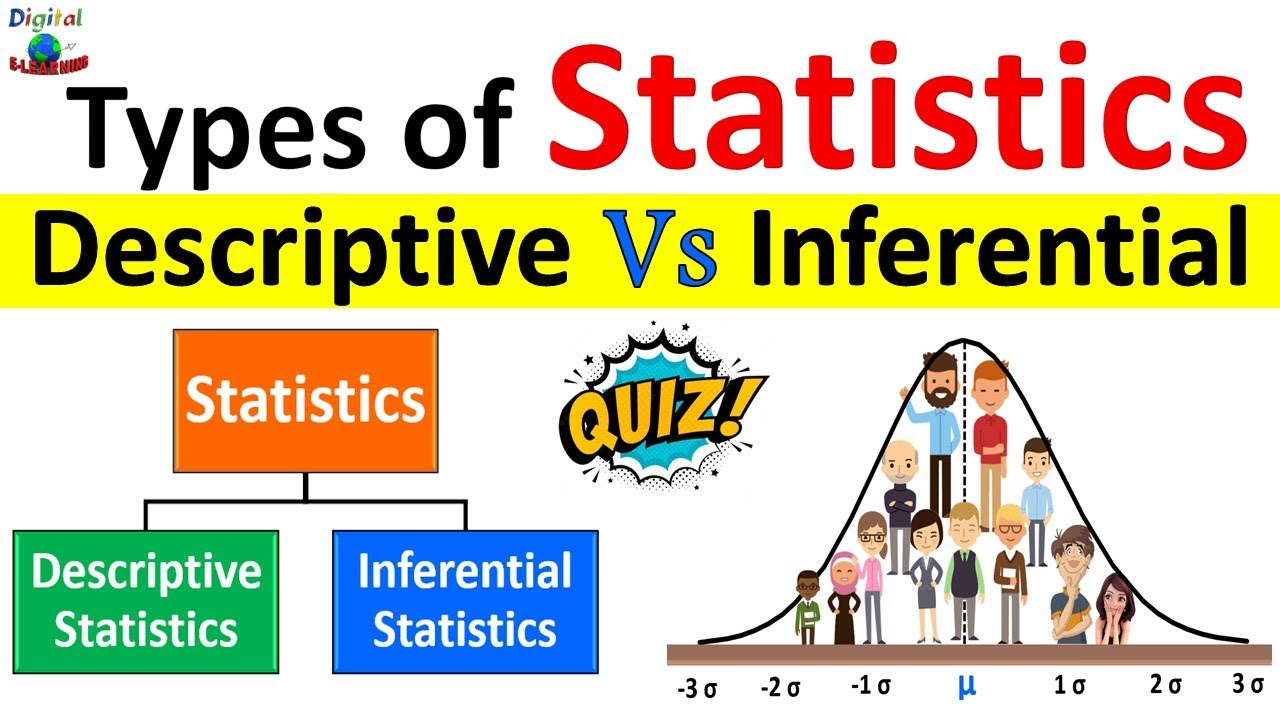
- 📉 Statistics has two main categories: descriptive and inferential statistics.
- 📈 Descriptive statistics involves organizing and summarizing data using numbers and graphs, such as bar graphs, histograms, pie charts, and line graphs.
- 📊 Measures of central tendency in descriptive statistics include mean, median, and mode.
- 🔢 The mean can be classified as the sample mean (sum of sample data divided by sample size) or the population mean (sum of population data divided by population size).
- 🎯 Inferential statistics involves making inferences or conclusions about a population based on sample data, often using probability.
- 🎲 Example: A sample of 100 people from a city is used to infer that 20% of the population prefers blue cars, which falls under inferential statistics.
- 📏 Inferential statistics also includes confidence intervals to express how confident we are in the accuracy of a conclusion, often stated as a percentage.
- 🔄 A larger sample size leads to a more accurate reflection of the population’s preferences or characteristics.
- ✔️ Increasing the sample size helps reduce the margin of error and provides better predictions about the population.
Q & A
What is the main purpose of statistics?
-Statistics is the science of collecting, analyzing, interpreting, and presenting data.
What are the two main branches of statistics?
-The two main branches of statistics are descriptive statistics and inferential statistics.
What is descriptive statistics?
-Descriptive statistics involves organizing and summarizing data using numbers, graphs, and other visual tools to describe data patterns.
What types of graphs are commonly used in descriptive statistics?
-Common graphs in descriptive statistics include bar graphs, histograms, pie charts, and line graphs.
What is the difference between a bar graph and a histogram?
-In a bar graph, the bars are separate, while in a histogram, the bars are attached, representing continuous data.
What are measures of central tendency in descriptive statistics?
-Measures of central tendency include the mean, median, and mode, which describe the central point or typical value of a data set.
What is the difference between the sample mean and the population mean?
-The sample mean is the average of a sample, while the population mean is the average of the entire population.
What is inferential statistics?
-Inferential statistics uses sample data to make conclusions or inferences about a larger population.
How does sample size affect inferential statistics?
-A larger sample size increases confidence and accuracy in the inferences made about the population.
What is a confidence interval in inferential statistics?
-A confidence interval is a range in which the true population parameter is expected to fall, based on sample data, with a certain level of confidence.
Outlines

هذا القسم متوفر فقط للمشتركين. يرجى الترقية للوصول إلى هذه الميزة.
قم بالترقية الآنMindmap

هذا القسم متوفر فقط للمشتركين. يرجى الترقية للوصول إلى هذه الميزة.
قم بالترقية الآنKeywords

هذا القسم متوفر فقط للمشتركين. يرجى الترقية للوصول إلى هذه الميزة.
قم بالترقية الآنHighlights

هذا القسم متوفر فقط للمشتركين. يرجى الترقية للوصول إلى هذه الميزة.
قم بالترقية الآنTranscripts

هذا القسم متوفر فقط للمشتركين. يرجى الترقية للوصول إلى هذه الميزة.
قم بالترقية الآنتصفح المزيد من مقاطع الفيديو ذات الصلة
Introduction to Statistics (1.1)
Descriptive Statistics vs Inferential Statistics | Measure of Central Tendency | Types of Statistics

KUPAS TUNTAS: Apakah Perbedaan Statistik Inferensial dengan Statistik Deskriptif ?
Statistik 2: pembagian statistika
Statisitik ke 3-1

KUPAS TUNTAS: Apakah Perbedaan Statistik Inferensial dengan Statistik Deskriptif ?
5.0 / 5 (0 votes)
