Phylogeny | Evolutionary Relationship | Tree Diagram

ATP for Learning
24 Feb 202305:21

Summary

TLDRThis script explains how scientists use tree diagrams to illustrate the evolutionary relationships among living organisms. By organizing creatures into branching patterns, the diagrams show a best guess of how they are related through reproductive lineages. The branching points represent common ancestors, and the order of traits along branches indicates the sequence of evolutionary changes. The script emphasizes that tree diagrams are hypotheses based on available evidence, which can be revised with new data, such as fossils, and that the key information lies in the branch points rather than the order of organisms at the top.

Takeaways

  • 🌳 Humans naturally organize things by similarities and differences, but evolutionary relationships require a different approach, using branching tree diagrams.
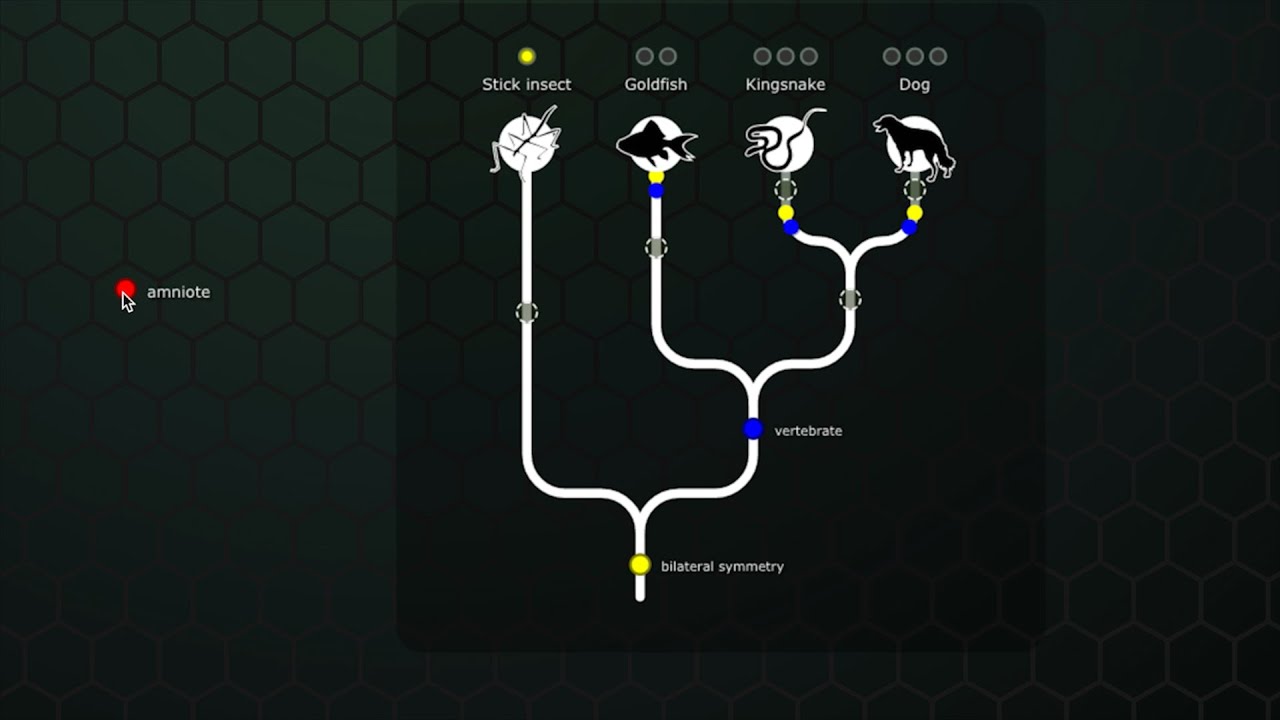
  • 🔍 Tree diagrams represent the evolutionary relationships among living organisms, assuming a common ancestry and showing how they diverged over time.
  • 🌱 The base of the tree diagram symbolizes a hypothetical common ancestor, with the tips representing current living descendants.
  • 🔗 Branches in the tree diagram represent reproductive lineages, showing how species diverged from one another.
  • 🔄 The order of traits along the branches indicates the sequence in which evolutionary changes occurred.
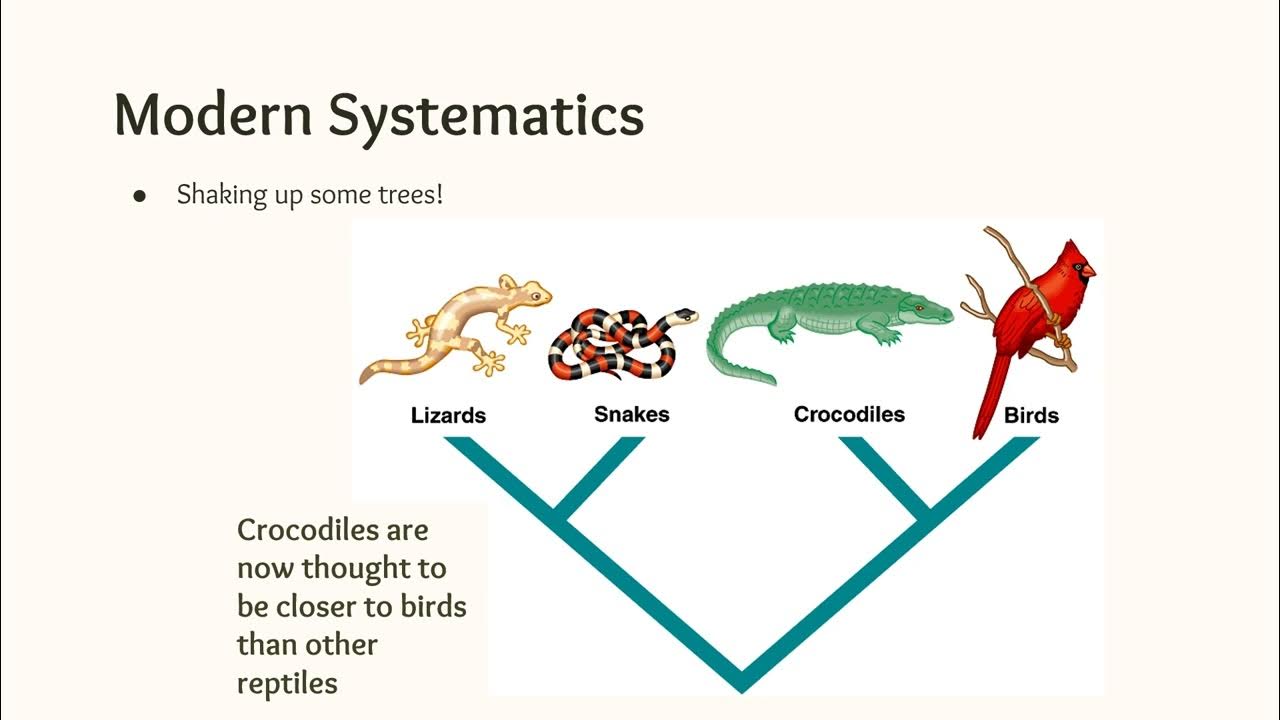
  • 🔎 Branch points or nodes in the tree represent common ancestors, with the most recent common ancestor shared by all branches beyond it.
  • 🔑 The closeness of relatedness between species can be inferred from the number of traits they share and the recency of their common ancestor.
  • 🔄 The order of organisms across the top of the tree diagram is not significant; the key information lies in the branch points.
  • 💠 Tree diagrams are hypotheses based on available evidence and can be revised with new data, such as fossils.
  • 🧬 Scientists use multiple lines of evidence, including anatomy, fossils, embryonic development, and DNA and amino acid sequences, to construct these diagrams.
  • 🌐 Despite the variety of ways tree diagrams can be drawn, they adhere to consistent organizational rules to represent evolutionary relationships.

Q & A

  • How do humans naturally organize things?

    -Humans naturally organize things by grouping them based on their similarities and differences.

  • What makes evolutionary relationships different from other types of organization?

    -Evolutionary relationships are different because they depict how living things are related through their shared ancestry, typically represented in tree diagrams.

  • What is the underlying assumption when organizing living things into tree diagrams?

    -The underlying assumption is that all living things descended from a common ancestor.

  • How do the branches in a tree diagram represent the evolutionary relationships?

    -The branches in a tree diagram represent the reproductive lineages of organisms and how they split over time.

  • What does the base of a tree diagram symbolize?

    -The base of a tree diagram symbolizes a hypothetical common ancestor from which all the organisms at the tips of the branches are descended.

  • How do branch points or nodes in a tree diagram relate to common ancestors?

    -Branch points or nodes in a tree diagram represent common ancestors, with the most recent common ancestor being the one that is shared by all branches beyond it.

  • What does the order of organisms across the top of a tree diagram indicate?

    -The order of organisms across the top of a tree diagram does not indicate anything; the key information is in the branch points.

  • How can the arrangement of branches around a node affect the interpretation of a tree diagram?

    -Rotating the branches around a node does not change the relationships shown in the tree, as long as the nodes are in the same relative order.

  • What evidence could support the direction of evolution depicted in a tree diagram?

    -Fossils found in layers of rock can provide evidence for the direction of evolution, suggesting whether lineages evolved from simple to complex or vice versa.

  • What other types of evidence do scientists use to organize real organisms in tree diagrams?

    -Scientists use characteristics from anatomy, fossils, embryonic development, and DNA and amino acid sequences to organize real organisms in tree diagrams.

  • Why might a tree diagram be redrawn?

    -A tree diagram might be redrawn when new evidence comes to light, as tree diagrams are hypotheses based on the best available evidence at the time.

Outlines

00:00

🌳 Understanding Evolutionary Relationships Through Tree Diagrams

This paragraph explains how human beings naturally organize things based on similarities and differences, but when it comes to evolutionary relationships, a different approach is needed. Scientists use branching tree diagrams to illustrate the relationships among living organisms, assuming they all descended from a common ancestor. The tree diagram is a hypothesis that represents the best guess of how living things are related through reproductive lineages. The base of the tree represents a hypothetical common ancestor, with the branches signifying the lineage and the tips representing living descendants. As we move up the tree, we observe the first branch point where one lineage splits into two, defined by the differences in the traits of the descendants. The order of traits along the branches indicates the sequence in which they evolved. The branch points or nodes represent common ancestors, with the most recent common ancestor to all branches being at the base. The closeness of relationship between creatures is indicated by the recency of their shared ancestor or the number of traits they have in common. The paragraph also highlights that the order of organisms at the top of the tree is not significant; it's the branch points that convey the key information. The assumption of evolution from simple to complex can be challenged, and tree diagrams may need to be redrawn with new evidence, such as fossils, which can provide insights into the direction of evolution. The paragraph concludes by mentioning that tree diagrams are based on various lines of evidence, including anatomy, fossils, embryonic development, and DNA and amino acid sequences.

05:00

📊 The Rules of Tree Diagram Organization

The second paragraph emphasizes that tree diagrams, despite being drawn in various ways, adhere to a consistent set of organizational rules. The key rule is that organisms with more characteristics in common are assumed to share a more recent common ancestor. This principle is fundamental to understanding the evolutionary relationships depicted in tree diagrams.

Mindmap

Keywords

💡Organizers

In the context of the video, 'organizers' refers to the natural human tendency to categorize and arrange things based on similarities and differences. This concept is crucial as it sets the stage for understanding how scientists approach the classification of living organisms. The video emphasizes that while there is no 'right or wrong' way to organize most things, the organization of evolutionary relationships requires a different approach, leading to the use of tree diagrams.

💡Evolutionary Relationships

This term is central to the video's theme, highlighting the connections between different species based on their shared characteristics and common ancestry. The video explains that scientists represent these relationships using branching tree diagrams, which illustrate how living things are hypothesized to have evolved from a common ancestor. The branching pattern in these diagrams symbolizes the divergence of species over time.

💡Tree Diagrams

Tree diagrams are a key concept in the video, used to visually represent the evolutionary history of organisms. They are branching structures where each branch point or node indicates a common ancestor, and the branches themselves represent the lineages that evolved from that ancestor. The video uses a hypothetical example of imaginary creatures to demonstrate how tree diagrams can show the order in which traits evolved and how species are related.

💡Common Ancestor

The 'common ancestor' is a fundamental concept in evolutionary biology, referring to a species from which multiple other species have descended. In the video, the base of the tree diagram symbolizes a hypothetical common ancestor, and the branches extending from it represent the evolutionary paths that led to the organisms at the tips of the branches, which are the living descendants.

💡Reproductive Lineages

Reproductive lineages are the paths of descent from a common ancestor to the present-day organisms. The video explains that the branches in a tree diagram represent these lineages, showing how species have evolved and diverged over time. The branching points in the diagram indicate where one lineage split into two, leading to the development of new traits and the emergence of new species.

💡Branch Points or Nodes

In the video, 'branch points' or 'nodes' are the intersections in the tree diagram where a lineage splits into two or more descendant lineages. These points represent common ancestors that are shared by the branches that extend from them. The video uses branch points to illustrate how traits evolved in specific lineages after they had diverged from other lineages.

💡Traits

Traits are the characteristics of organisms that can be inherited and are often used to classify and understand evolutionary relationships. The video discusses how differences in traits define the branches in a tree diagram, with each branch point marking the evolution of a new trait, such as the development of additional body segments, wings, or antennae.

💡Fossils

Fossils play a critical role in validating evolutionary hypotheses, as they provide physical evidence of past life forms. The video suggests that the order in which fossils appear in geological layers can support or contradict the branching patterns in tree diagrams. If fossils show a progression from simpler to more complex forms, as found in older to younger rock layers, it supports the idea that lineages evolved in that direction.

💡Hypotheses

The video emphasizes that tree diagrams are hypotheses, which are educated guesses based on available evidence. They represent the best understanding of evolutionary relationships at a given time. The video explains that these hypotheses can change as new evidence, such as additional fossils or genetic data, comes to light.

💡DNA and Amino Acid Sequences

Although not explicitly detailed in the provided script, DNA and amino acid sequences are mentioned as additional lines of evidence used by scientists to organize real organisms. These molecular sequences provide insights into genetic similarities and differences between species, which can help refine the tree diagrams and confirm or refute hypotheses about evolutionary relationships.

Highlights

Humans naturally organize things by similarities and differences.

Evolutionary relationships are organized into branching tree diagrams to show how living things are related.

All living things are assumed to have descended from a common ancestor.

Branching tree diagrams represent the best guess at how living things are related through reproductive lineages.

Tree diagrams are used to organize imaginary creatures in a line from simple to complex.

The base of the tree represents a hypothetical common ancestor.

Organisms at the tips of the tree represent living descendants.

Branches represent reproductive lineages and how they split over time.

Branch points in the tree diagram signify the evolution of new traits in lineages.

The order of traits in the tree diagram indicates the sequence in which they arose.

Connections to common ancestors reveal which creatures are more closely related.

The number of shared traits can indicate the closeness of the relationship between creatures.

The order of organisms across the top of the tree does not provide information about relationships.

Tree diagrams are hypotheses based on available evidence and may be redrawn with new evidence.

Fossils can provide additional information to support the direction of lineage evolution in tree diagrams.

Scientists use a combination of anatomical characteristics, fossils, embryonic development, and DNA sequences to organize real organisms.

Tree diagrams follow the same rules of organization regardless of how they are drawn.

Organisms with more characteristics in common share a more recent common ancestor.

Transcripts

play00:00

human beings are natural organizers we

play00:03

group things by their similarities and

play00:05

differences for most things there's no

play00:08

right or wrong way to organize them

play00:12

but evolutionary relationships are

play00:14

different to show how living things are

play00:17

related scientists organize them into

play00:20

branching tree diagrams

play00:23

since living things share so many

play00:25

fundamental characteristics the

play00:27

underlying assumption is that they all

play00:29

descended from a common ancestor

play00:32

and the branches are a best guess at how

play00:35

the living things at the tips are

play00:37

related through reproductive lineages

play00:39

[Music]

play00:41

to show the general idea of how tree

play00:44

diagrams work let's organize this group

play00:47

of imaginary creatures

play00:48

one way to organize them is to arrange

play00:52

them in a line from simple to complex

play00:54

and then connect them with lines or

play00:57

branches the lower branches connect to

play01:00

the simpler creatures and the higher

play01:02

branches to the more complex ones

play01:05

this diagram is a best guess at how

play01:09

these creatures may be related now let's

play01:12

look at what the diagram is telling us

play01:15

the base represents a hypothetical

play01:18

common ancestor and the organisms at the

play01:21

tips represent living descendants the

play01:25

branches represent reproductive lineages

play01:27

and how they split over time

play01:30

starting at the bottom or farther back

play01:33

in time we can see that there was just

play01:36

one reproductive lineage moving forward

play01:39

in time we see what happened over many

play01:41

many generations

play01:43

here we reach our first Branch point

play01:46

where one lineage split into two

play01:50

the branches are defined by differences

play01:53

in the traits of The Descendants the

play01:56

organism connected to the left branch is

play01:58

the simplest all of the ones connected

play02:01

to the right branch have an additional

play02:03

body segment this trait evolved in this

play02:06

lineage after the branch point

play02:09

moving forward in time we reach another

play02:12

Branch point

play02:13

the creatures that connect to the branch

play02:16

on the right have a longer abdomen this

play02:19

pattern continues the next trait to come

play02:21

along is Wings followed by antennae

play02:25

looking at the branching pattern we can

play02:28

see the order in which various traits

play02:30

arose

play02:32

remember that the branches represent

play02:34

lineages of ancestors

play02:36

the branch points or nodes represent

play02:40

common ancestors or more specifically

play02:43

the most recent ancestor that is common

play02:45

to all the branches Beyond it

play02:48

so this common ancestor is shared by all

play02:52

of the creatures on the tree and this

play02:54

common ancestor is shared only by the

play02:57

ones with wings

play02:59

connections to common ancestors can tell

play03:01

you which creatures are more closely

play03:03

related

play03:04

[Music]

play03:05

it's two creatures share an ancestor

play03:08

that lived more recently than the

play03:10

ancestor they share with this creature

play03:13

another way to look at relatedness is to

play03:16

look at the number of traits that the

play03:18

creatures have in common

play03:21

two have more traits in common than

play03:24

these two

play03:28

one thing that's really important to

play03:30

know about trees is that the order of

play03:33

organisms across the top doesn't tell

play03:35

you anything the key information is in

play03:38

the branch points

play03:40

if we rotate the branches around a node

play03:43

the tree still shows the same

play03:46

relationships all of these trees because

play03:49

the nodes are in the same relative order

play03:51

are equivalent another thing to call out

play03:55

is that we made an assumption when we

play03:57

drew our tree we assumed that the

play03:59

lineages evolved from simple to complex

play04:03

but we could have just as easily drawn

play04:06

our tree like this with each branch

play04:08

Point representing the loss of the trait

play04:11

how do we know which one is more likely

play04:14

well fossils could give us more

play04:16

information

play04:18

say we found a whole series of fossils

play04:20

in layers of rock and the oldest one the

play04:24

one at the bottom was the

play04:26

that evidence would suggest that the

play04:28

first way we drew the tree was correct

play04:31

because tree diagrams are hypotheses a

play04:35

best guess at evolutionary relationships

play04:37

based on available evidence they may be

play04:40

redrawn when new evidence comes to light

play04:43

[Music]

play04:46

scientists use characteristics from

play04:49

anatomy and fossils to organize real

play04:51

organisms too they also use other lines

play04:54

of evidence including how organisms

play04:57

develop as embryos and DNA and amino

play05:00

acid sequences

play05:03

tree diagrams can be drawn in many

play05:05

different ways but no matter how they're

play05:07

drawn they follow the same rules of

play05:10

organization

play05:12

in general organisms that have more

play05:15

characteristics in common share a more

play05:17

recent common ancestor

Rate This

5.0 / 5 (0 votes)

الوسوم ذات الصلة
EvolutionTree DiagramsCommon AncestorOrganismsReproductive LineagesFossil EvidenceAnatomyEmbryonic DevelopmentDNA SequencesEcologyBiological Relationships
هل تحتاج إلى تلخيص باللغة الإنجليزية؟