Production Possibilities Curve- Macro Topic 1.2 (Micro Topic 1.3)

Jacob Clifford
31 Jul 201907:15

Summary

TLDRIn this educational video, Jacob Clifford introduces viewers to the concept of the production possibilities curve through an interactive drawing game. Participants draw squares and triangles within a time limit, illustrating scarcity and the trade-offs between goods. The video explains the curve's significance in economics, including efficiency, opportunity cost, and the law of increasing opportunity cost. It also touches on how improved resources or technology can shift the curve, leading to economic growth. The video concludes with a call to action for viewers to practice these concepts and offers a free resource for further learning.

Takeaways

  • 😀 The video introduces an economics game where participants draw shapes within a time limit, illustrating the concept of scarcity and efficiency.
  • ✏️ Participants are challenged to draw squares with their non-dominant hand, emphasizing the impact of resource allocation on production.
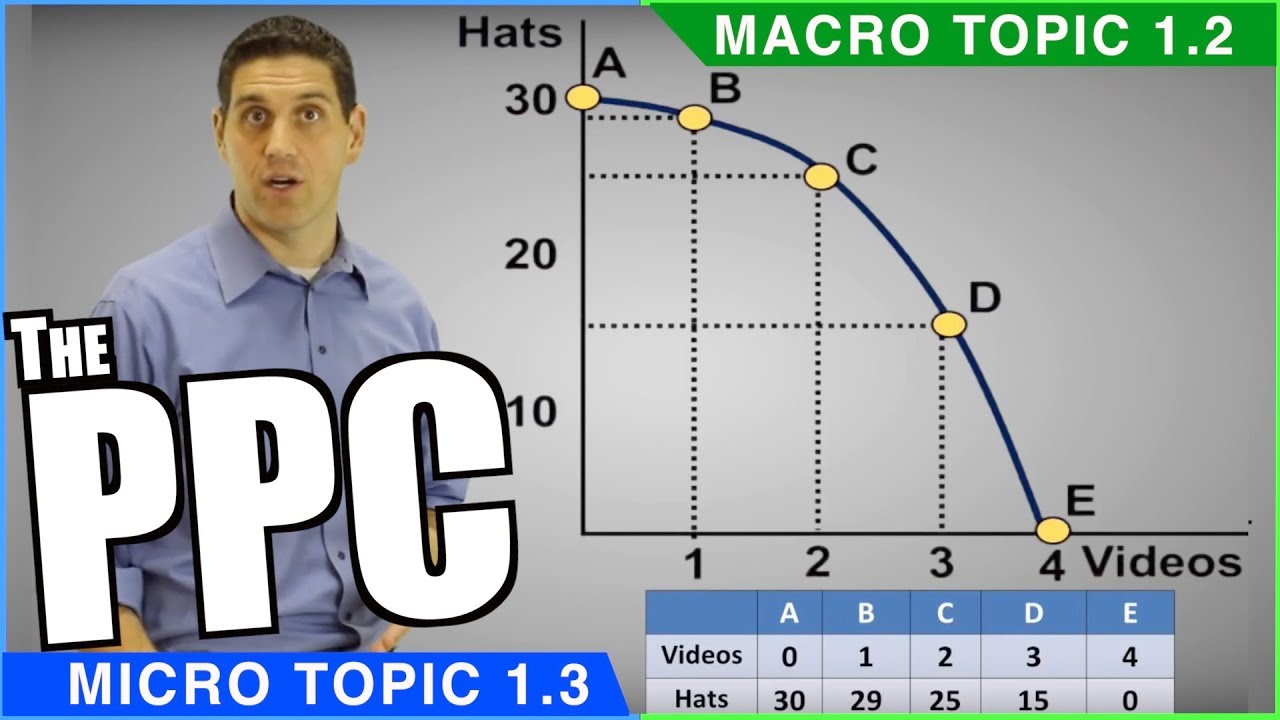
  • 📊 The production possibilities curve (PPC) is introduced as a tool to visualize the trade-offs between two goods, showing the limits of production due to scarcity.
  • 🔄 The concept of opportunity cost is explained through the game, highlighting the idea that choosing one option means giving up another.
  • 📉 The video demonstrates the law of increasing opportunity cost, using the analogy of picking cherries versus playing video games to show how opportunity costs can change.
  • 📈 The script explains how the PPC can shift outward due to increased productivity, better resources, or technological advancements, representing economic growth.
  • 🛠️ The video uses a 'double pencil' as a memory device to symbolize productivity and economic growth, reinforcing the idea that improvements in these areas can expand the PPC.
  • 💡 The importance of understanding and calculating opportunity cost is stressed, as it is a fundamental skill in economics for making informed decisions.
  • 📚 The video promotes an educational resource called the 'ultimate review packet' for further study and practice of economic concepts, including the PPC.
  • 🎓 The script concludes with a call to action for viewers to like, subscribe, and participate in a pop quiz to test their understanding of the video's content.

Q & A

  • What is the main activity Jacob asks viewers to participate in at the beginning of the video?

    -Jacob asks viewers to draw as many squares as they can in ten seconds using their non-dominant hand.

  • What is the purpose of the drawing activity in the video?

    -The purpose of the drawing activity is to illustrate the concept of production possibilities and opportunity cost in economics.

  • What does the production possibilities curve (PPC) represent?

    -The production possibilities curve represents the different combinations of goods that can be produced with available resources, given a certain level of technology and full employment of resources.

  • Why can't Jacob produce 15 squares and 10 triangles simultaneously according to the PPC?

    -Jacob cannot produce 15 squares and 10 triangles simultaneously because such a combination is outside the PPC, indicating it is unattainable with the current resources and technology.

  • What does a point inside the PPC signify?

    -A point inside the PPC signifies inefficiency, as it represents a scenario where resources are not being fully utilized.

  • What is the concept of opportunity cost explained in the video?

    -Opportunity cost is the value of the next best alternative that is foregone when making a decision. In the video, it is demonstrated by the number of squares Jacob has to give up to produce additional triangles.

  • How does the law of increasing opportunity cost apply to the example of picking cherries?

    -The law of increasing opportunity cost applies to picking cherries as the easier cherries are picked first, and as one moves to higher branches, the opportunity cost of picking each additional basket of cherries increases.

  • What does a bowed-out shape of the PPC indicate?

    -A bowed-out shape of the PPC indicates that the opportunity cost is not constant; it increases as one moves from producing one good to producing more of another.

  • What does a shift in the PPC represent?

    -A shift in the PPC represents an increase in productivity, which could be due to more resources, better resources, or improved technology, allowing for the production of more output.

  • How can the PPC be applied to the overall economy?

    -The PPC can be applied to the overall economy by showing combinations inside the curve as representing unemployment, points on the curve as full employment, and points outside the curve as potential growth areas.

  • What resource does Jacob offer to help viewers practice and review economic concepts?

    -Jacob offers 'The Ultimate Review Packet' which includes study guides, exclusive videos, and worksheets to help practice and review macro and microeconomics.

Outlines

00:00

📊 Introduction to Production Possibilities Curve

Jacob Clifford introduces an economics game where participants draw squares and triangles within a time limit using their non-dominant hand to illustrate the concept of scarcity and efficiency. He explains the production possibilities curve (PPC), which shows the different combinations of goods that can be produced given limited resources. The video emphasizes the idea of opportunity cost, which is the cost of the next best alternative forgone. The opportunity cost is constant in this example, as producing one more triangle always results in giving up three squares. The video also introduces the Ultimate Review Packet as a resource for practicing and reviewing economics concepts.

05:00

🔄 Shifts in the Production Possibilities Curve

The second paragraph delves into how the PPC can shift outward, indicating increased productivity and economic growth. This shift can occur due to additional resources, improved technology, or better human capital. The video explains that points inside the PPC represent inefficiency, such as unemployment, while points on the curve represent full employment and efficiency. Points outside the curve are unattainable with current resources. The video concludes with a call to action for viewers to like and subscribe, and it introduces a pop quiz to reinforce learning. The host also provides a memory device for the concept, suggesting viewers associate the PPC with a hat and a double pencil as visual aids.

Mindmap

Keywords

💡Economics Game

The 'Economics Game' refers to the interactive activity Jacob Clifford initiates to illustrate economic concepts through drawing squares and triangles within a time limit. It's a fun and engaging way to introduce viewers to economic principles, such as scarcity and trade-offs, in a relatable and visual manner.

💡Scarcity

Scarcity is a fundamental economic concept that refers to the limited availability of resources relative to the unlimited wants and needs of society. In the video, scarcity is demonstrated by the inability to produce an unlimited number of squares and triangles within the given time, hence showing that choices must be made due to limited resources.

💡Production Possibilities Curve (PPC)

The Production Possibilities Curve is a graph that shows the different combinations of goods that can be produced with a given amount of resources. In the video, the PPC is used to visualize the trade-offs between producing squares and triangles, highlighting the concept that producing more of one good means producing less of another due to scarcity.

💡Efficiency

Efficiency in economics means using resources in the best way possible to achieve the most output. The video explains that points on the PPC represent efficient production, where all resources are being fully utilized without waste, unlike points inside the curve which represent underutilization and inefficiency.

💡Trade-offs

Trade-offs are the choices made between two alternatives given limited resources. The video uses the example of choosing between producing squares or triangles to explain that increasing production of one good comes at the expense of the other, thus highlighting the necessity of making trade-offs.

💡Opportunity Cost

Opportunity cost is the benefit an individual, investor, or business misses out on when choosing one alternative over another. It is the cost of the next best alternative that is foregone. In the video, the opportunity cost is illustrated by the number of squares Jacob gives up to produce additional triangles.

💡Law of Increasing Opportunity Cost

The Law of Increasing Opportunity Cost states that as more of one good is produced, the opportunity cost of producing more of it increases. The video uses the analogy of picking cherries to explain this concept, where the easier cherries are picked first, and as one moves to harder-to-reach cherries, the opportunity cost of picking additional cherries increases.

💡Resources

Resources in economics include all inputs used in the production of goods and services, such as labor, capital, and land. The video discusses how having more or better resources can shift the PPC outward, indicating an increase in productive capacity and economic growth.

💡Full Employment

Full employment refers to a situation where all available labor resources are being used efficiently. In the context of the video, points on the PPC represent full employment, where all resources are being utilized to their maximum potential without waste.

💡Economic Growth

Economic growth is the increase in the production capacity of an economy over time. The video explains how economic growth can occur through the acquisition of more resources, better resources, or improved technology, which allows for a shift in the PPC to produce more output.

💡Ultimate Review Packet

The 'Ultimate Review Packet' mentioned in the video is a resource designed to help viewers practice and review economic concepts. It includes study guides, videos, and worksheets, and is offered as a free resource to assist in learning and understanding economics more deeply.

Highlights

Introduction of an economics game involving drawing squares and triangles within a time limit.

Emphasis on using the non-dominant hand to illustrate the concept of scarcity.

Explanation of production possibilities through the number of shapes drawn.

Introduction of the production possibilities curve in economic theory.

Discussion on the concept of efficiency and the inability to produce outside the curve.

Illustration of the idea that points inside the curve represent inefficiency.

Explanation of trade-offs in resource allocation.

Introduction to the concept of opportunity cost in economic decisions.

Calculation of opportunity cost using the example of squares and triangles.

Introduction of the law of increasing opportunity cost.

Example of picking cherries and playing video games to explain increasing opportunity cost.

Importance of calculating opportunity cost when making economic choices.

Discussion on how the production possibilities curve can shift due to increased resources or technology.

Application of the production possibilities curve to the overall economy.

Mention of the Ultimate Review Packet as a resource for practicing economic concepts.

Memory devices introduced to help remember the production possibilities curve and economic growth.

Encouragement for viewers to like, subscribe, and participate in a pop quiz.

Transcripts

play00:00

hey Internet this is Jacob Clifford now

play00:01

it's time to play an economics game not

play00:03

believe if James you're $200 you landed

play00:06

on his property

play00:07

no he's in jail I'm not gonna give money

play00:10

to a criminal no actually this one's

play00:13

more of a race so go grab a pencil and a

play00:16

paper or when I say go I want you to

play00:17

draw as many squares as you possibly can

play00:20

in ten seconds and I'll tell you when to

play00:22

start and with a stop but there's a

play00:23

catch here you've got to use your right

play00:25

hand even if you're left-handed you got

play00:27

to use your right hand so I'll give you

play00:28

a few seconds to get ready so on your

play00:34

marks get set go

play00:37

[Music]

play00:47

stop well done great job now this time

play00:49

you're doing the same thing over again

play00:51

except switch to your left hand even if

play00:52

you're right-handed you're doing this

play00:54

left-handed and you're drawing as many

play00:56

triangles as you can in ten seconds on

play00:58

your marks get set go

play01:01

[Music]

play01:10

stop great job all right now let's see

play01:13

if you actually beat me I got 15 squares

play01:15

and only five triangles and some of

play01:18

those triangles are really rough these

play01:20

numbers give you your production

play01:22

possibilities the amount of squares and

play01:24

triangles you can produce in 10 seconds

play01:26

and you can use these numbers to draw

play01:27

the very first graphs that you learn in

play01:29

an econ class the production

play01:30

possibilities curve illustrates a lot of

play01:32

the key concepts that you learn in

play01:34

economics for example notice that I

play01:36

can't produce 15 squares and 10

play01:38

triangles all at the same time I can't

play01:40

produce any combination that's outside

play01:42

the curve why well because of scarcity

play01:44

any combination on the graph is possible

play01:48

and it shows the idea of efficiency

play01:49

because I'm using all of my resources to

play01:51

the fullest now imagine instead I

play01:53

produce one square and only one triangle

play01:55

now obviously I'm under utilizing my

play01:57

resources the pencil and my time is

play02:00

being wasted so any point inside the

play02:02

curve is inefficient because I'm not

play02:04

using all of my resources and the graph

play02:06

also shows the idea of trade-offs when

play02:08

you produce triangles you can't also at

play02:09

the same time produce squares right when

play02:12

you produce one means you can't produce

play02:13

the other one again because of scarcity

play02:15

now there's a skill here that you

play02:17

absolutely have to be able to do and

play02:19

practice it's calculating opportunity

play02:22

cost now this goes one step further than

play02:24

the idea of trade-offs opportunity cost

play02:26

is the specific number of squares that

play02:28

you give up when you produce a certain

play02:30

number of triangles in my case I gained

play02:32

five triangles but it cost me 15 squares

play02:35

so each one triangle cost me 3 squares

play02:38

now if I put all my time in producing

play02:40

squares then I have to give up the five

play02:42

triangles so each one square cost me one

play02:45

third of a triangle that's my

play02:47

opportunity cost my example is a little

play02:49

easier because there's only two

play02:50

combinations and I'm assuming the

play02:52

opportunity cost is constant that means

play02:54

every single time I produce a triangle

play02:56

I'm going to give up another three

play02:58

squares so another triangle give up

play03:00

three squares another triangle give up

play03:02

another three squares you see constant

play03:04

opportunity cost by calculating

play03:06

opportunity cost gets a lot harder when

play03:09

the curve has a different shape for

play03:10

example when it's boat out like this

play03:13

this graph shows the idea of the law of

play03:15

increasing opportunity cost which is a

play03:17

lot easier to explain given a different

play03:19

examples let's use playing video games

play03:21

and picking cherries

play03:22

when you

play03:22

pick cherries you don't start the top of

play03:24

the tree and try to get the hardest ones

play03:26

to reach you start with the easy ones

play03:28

the low-hanging fruit you grab those

play03:30

really quick and then move on to the

play03:31

next level and keep doing that over and

play03:33

over again until finally eventually you

play03:35

get to the ones that on the very top

play03:37

they're super hard to reach notice that

play03:39

the opportunity cost of each basket of

play03:41

cherries that you pick is not constant

play03:43

it gets bigger and bigger now on the

play03:45

graph here's the combination that you're

play03:47

producing if all you're doing is playing

play03:48

video games when you go pick some

play03:50

cherries that first basket is super

play03:52

quick and easy to fill and you still

play03:54

have plenty of time to play a lot of

play03:55

video games

play03:56

the opportunity cost from picking that

play03:57

first basket is really low if you pick

play04:00

another basket of cherries it's gonna

play04:01

cost more time so now you have even more

play04:03

video games that you have to give up the

play04:05

opportunity cost is a little bigger and

play04:07

this keeps happening over and over again

play04:09

until that last basket of cherries and

play04:11

you're spending all your time trying to

play04:13

get those cherries and fill that basket

play04:14

so you have no time for video games

play04:16

notice increasing opportunity cost but

play04:19

the most important thing is you have to

play04:21

be able to calculate the opportunity

play04:22

cost when you're moving between

play04:23

different combinations in the graph if

play04:25

you see a straight line that's constant

play04:27

opportunity cost and opportunity cost is

play04:28

the same a bowed out curve means the

play04:31

opportunity cost is different and in

play04:32

both cases it all depends if you're

play04:34

moving up the curve or down the curve

play04:36

this is a skill that you have to

play04:38

practice and the good news is I have a

play04:40

resource that's gonna help you do just

play04:41

that it's gonna help you practice and

play04:43

the best thing is it's free to start

play04:44

right now it's called the ultimate

play04:46

review packet and includes study guides

play04:48

exclusive videos and worksheets to help

play04:51

you practice and review macro and

play04:53

microeconomics the unit 1 study guide is

play04:55

waiting for you right now and it's free

play04:57

it's in the link in the description

play04:58

below but we're not done with the PPC

play05:00

quick review combinations inside the

play05:02

curve are inefficient on the curve our

play05:04

efficient outside the curve are

play05:06

unattainable given our current resources

play05:08

but what if we have more resources or

play05:11

better resources or better technology

play05:13

well in that case the production

play05:15

possibilities curve can actually shift

play05:17

notice that I still only have 10 seconds

play05:19

but now I can produce more than I ever

play05:20

did before this change in productivity

play05:23

allows me to reach combinations that

play05:24

were once impossible and again it's

play05:26

because I have better resources or more

play05:28

resources now this whole idea the

play05:30

concepts and the graph can be applied to

play05:32

the overall economy

play05:34

combinations inside the curve show

play05:35

unemployment because we're not using our

play05:37

resources points on the curve show the

play05:39

idea of full employment we're using all

play05:41

of our resource to the fullest

play05:42

we're being efficient and points outside

play05:44

the curve show you cannot produce them

play05:46

because they're beyond our current

play05:47

resources but if we have more resources

play05:50

like more physical capital like machines

play05:52

tools and factories or if we have better

play05:54

resources like more human capital where

play05:56

there's workers who are more experienced

play05:58

and knowledgeable and educated then we

play06:00

can produce more output and have

play06:02

economic growth over time so what is the

play06:04

memory device for this episode what's

play06:06

the widget that goes on the widget wall

play06:08

well there's gonna be two of them one is

play06:09

the hat that I used in the other video

play06:11

that I made about the production

play06:12

possibilities curve dye and the other

play06:14

one is gonna be my cool double pencil

play06:16

that shows the idea productivity and

play06:17

economic growth when you see these I

play06:19

want you to remember the production

play06:21

possibilities curve drawing all those

play06:22

triangles and squares and the idea that

play06:25

the curve can shift but don't go

play06:27

anywhere we still have two things to do

play06:29

number one it's time for you to like

play06:30

this video and subscribe also it's time

play06:33

for a pop quiz

play06:36

at the end of these videos I give you a

play06:38

few practice multiple-choice questions

play06:40

to make sure you're actually getting

play06:41

keep in mind they're not going to be on

play06:43

the screen for very long so you have to

play06:44

pause the video and answer the questions

play06:46

and look in the comments below for the

play06:48

answer key as always thank you so much

play06:50

for watching let me know how I can help

play06:51

you learn and love economics until next

play06:54

time

play07:02

you

Rate This

5.0 / 5 (0 votes)

الوسوم ذات الصلة
Economics GameProduction PossibilitiesOpportunity CostScarcityResource AllocationEconomic ConceptsEducational VideoEconomic GrowthLearning EconomicsEconomic Efficiency
هل تحتاج إلى تلخيص باللغة الإنجليزية؟