is the ROTATION complete now? Watch for THIS NEXT!
Summary
TLDRThe video discusses the ongoing sector rotation in the market, focusing on the decline of tech stocks and the rise of other sectors. It highlights the bullish trend in the Dow Jones, Berkshire Hathaway, and the S&P 500, while suggesting that the market is not bearish but experiencing a shift in investment focus. The speaker emphasizes the importance of being an unbiased trader and managing risk effectively.
Takeaways
- π The Dow Jones has reached a new all-time high, indicating a strong bullish market, especially as tech stocks are rotating out.
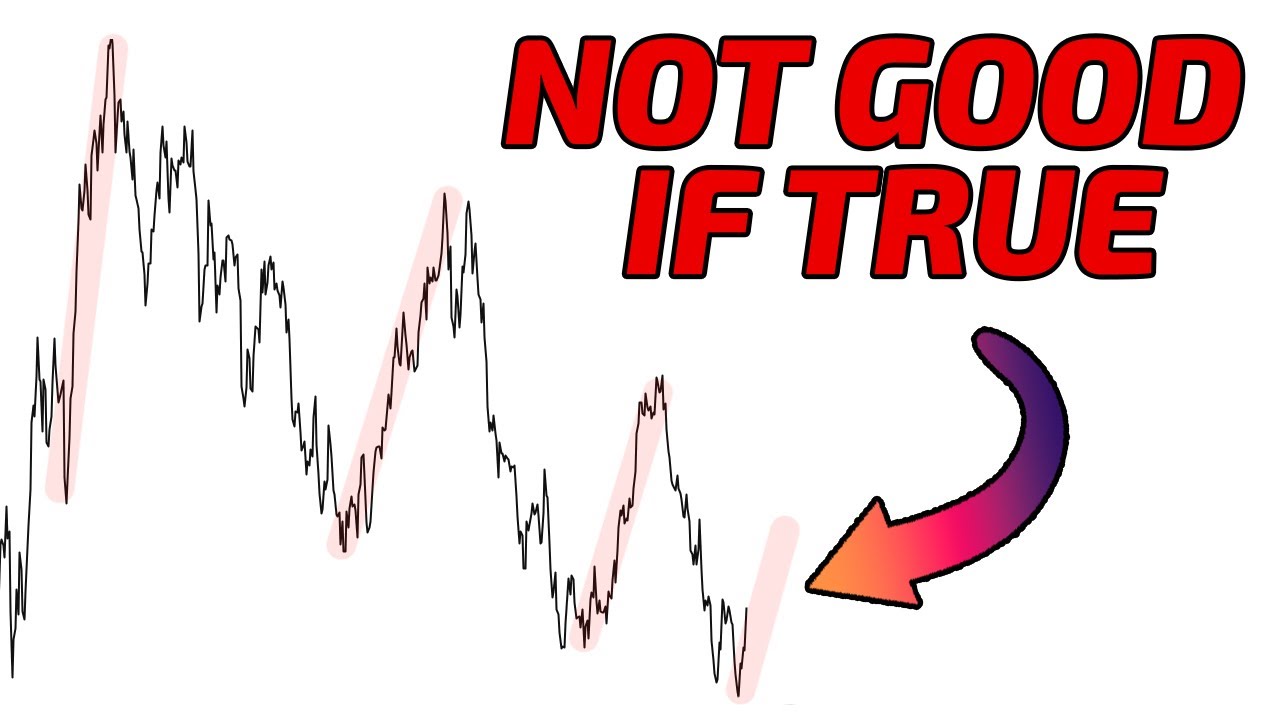
- π Sector rotation is in progress, with money leaving tech stocks and moving into other sectors, as evidenced by the Dow's rise and tech's decline.
- π The 'Magnificent Seven' tech stocks saw significant losses, reinforcing the need to look at other sectors for opportunities.
- π Berkshire Hathaway hit a new all-time high, suggesting strong performance outside the tech sector.
- π The NASDAQ 100 (Triple Q's) is experiencing a pullback, with potential support around 478-480, indicating a nearing end to the sector rotation.
- π‘ The speaker predicted the current market behavior, including the tech pullback and sector rotation, using chart analysis.
- π Focus is on identifying when the tech sector will find support and potentially rally again, contributing to an overall bullish market.
- π¦ Financial, industrial, and healthcare sectors are showing strength, further supporting the bullish market outlook.
- π The VIX (Volatility Index) is low, suggesting a lack of market fear and potential for further bullish movement.
- πΉ Bitcoin holding above $64,000 is another risk-on indicator, contributing to the positive market sentiment.
- π¬ The speaker emphasizes the importance of being an unbiased trader and following chart signals for successful trading.
Q & A
What is the main topic discussed in the video script?
-The main topic discussed in the video script is the sector rotation in the stock market, particularly the shift from tech stocks to other sectors, and the implications of this rotation on the Dow Jones, NASDAQ, and other indices.
What is the current status of the Dow Jones according to the script?
-The Dow Jones is currently at a new all-time high, having increased by 0.55% on the day of the script. It has surpassed the price target of 411 and is on its way to the next target of 415.
What is the significance of the 'Magnificent Seven tech stocks' mentioned in the script?
-The 'Magnificent Seven tech stocks' refer to the mega cap tech or big tech stocks that have been significantly impacted by the sector rotation. The script suggests that these stocks were not a good investment at the time due to the shift of capital to other sectors.
What is the script's stance on the current market being bearish?
-The script argues that the market is not bearish overall, despite the decline in tech stocks. The Dow Jones is at an all-time high, indicating a bullish market, but the bullishness is not uniform across all sectors, particularly tech.
What is the role of Berkshire Hathaway in the script's analysis?
-Berkshire Hathaway is used as an example of a stock that is performing well, having reached new all-time highs with a 1.53% increase on the day of the script. It illustrates the sector rotation theme where money is moving from tech to other sectors like industrials and financials.
What is the Triple Q's and why is it significant in the script?
-The Triple Q's likely refers to the NASDAQ 100 index (QQQ). It is significant because the script discusses its potential downward trend and how it fits into the broader theme of sector rotation, with money moving out of tech stocks.
What are the potential support levels for the Triple Q's mentioned in the script?
-The script suggests that the Triple Q's could find support between 478 and 480, which would be a critical level to watch for potential sector rotation completion.
What is the script's prediction for the S&P 500 index (SPY)?
-The script predicts that the S&P 500 index (SPY) could continue its bull trend, potentially reaching new all-time highs by the end of the month, provided it does not break below the support level of 556.
What is the VIX and how does it relate to the current market analysis in the script?
-The VIX, or Volatility Index, is a measure of the stock market's expected volatility. The script predicts that the VIX will decrease towards 13, indicating a lower expected volatility and a potential fuel for another bull rally.
What advice does the script give for traders in the current market?
-The script advises traders to be unbiased, focus on price action, and have a trade plan prepared for different scenarios. It also emphasizes the importance of managing risk at critical support levels and being aware of sector rotations.
Outlines
π Dow Jones and Sector Rotation Insights
The speaker begins by discussing the Dow Jones, questioning whether the sector rotation is complete. They emphasize that despite the tech sector's downturn, the Dow Jones is reaching new highs, indicating a bullish market. The 'Magnificent Seven tech stocks' are mentioned as being heavily impacted, but the speaker suggests that this is merely a shift of funds into other sectors. The speaker also highlights the importance of not focusing solely on tech stocks and instead looking at broader market opportunities. They discuss the potential for the Dow Jones to continue rising, with new price targets set, and mention the significant buying volume and bearish sentiment that could drive further growth. The speaker also touches on Berkshire Hathaway's performance, suggesting that a multi-month consolidation breakout indicates a strong bullish trend.
π Tech Sector Downturn and Market Analysis
The speaker delves into the tech sector's downturn, using the NASDAQ 100 and the S&P 500 as examples to illustrate the sector rotation. They predict that the tech sector's weakness could lead to a lower high rejection, which was evident in the price action. The speaker also discusses the potential support levels for the tech sector, suggesting that a break below certain levels could lead to further declines. They mention the importance of being prepared for various market scenarios and the need to read price action without bias. The speaker also covers the performance of the S&P 500 ETF (SPY), the Russell 2000 ETF (IWM), and the VIX, providing insights into their potential movements and the implications for the broader market. The discussion includes the possibility of a continued bull trend in the S&P 500 and the potential for the tech sector to recover after a period of cooling down.
π Bullish Breakouts and Market Opportunities
The speaker concludes by highlighting the potential for bullish breakouts in various sectors beyond tech. They discuss Lockheed Martin as an example of a stock breaking out of a multi-week consolidation, suggesting a powerful push upwards. The speaker emphasizes that there are numerous opportunities in the market, not just in tech stocks, and encourages viewers to look for these opportunities. They reiterate that the market is still bullish and that the sector rotation is likely nearing completion, which could lead to a broader market rally. The speaker also mentions other sectors like industrials, financials, and healthcare that are showing bullish trends. They conclude by advising viewers to manage risk and have a trade plan prepared for different market scenarios, and they invite viewers to join their Discord server for more trade ideas and intraday updates.
Mindmap
Keywords
π‘Dow Jones
π‘Sector Rotation
π‘Mega Cap Tech
π‘Berkshire Hathaway
π‘Triple Q's
π‘Support and Resistance
π‘S&P 500
π‘Russell 2000
π‘VIX
π‘Bitcoin
π‘Lockheed Martin
Highlights
The Dow Jones reached a new all-time high, indicating a bullish market despite tech sector struggles.
Sector rotation is evident as money moves from tech companies to other sectors, driving the Dow Jones up 0.55%.
The 'Magnificent Seven' tech stocks suffered significant losses, suggesting a shift in market focus.
Berkshire Hathaway hit new all-time highs, demonstrating strong market confidence in non-tech sectors.
The speaker predicts the Dow Jones could reach 420 if it breaks through the current resistance at 415.
The NASDAQ 100's lower high indicates a potential sector rotation away from tech, supporting the broader market's bullish trend.
The speaker suggests that the market is not bearish but experiencing a sector rotation, contrary to common perceptions.
The Russell 2000 ETF shows potential for continued bullish trends despite a 1.05% drop, highlighting resilience in small caps.
The VIX index is expected to decline towards 13, signaling a continued risk-on environment.
Bitcoin holding above $64,000 is seen as a positive risk-on indicator, suggesting further potential for market growth.
The XLI index, representing the industrial sector, shows a double bottom breakout, indicating strong bullish potential.
The XLF index, representing the financial sector, surpasses the price target, suggesting continued bullish momentum.
Lockheed Martin's breakout from a multi-week consolidation suggests a new bullish phase for the company.
The speaker emphasizes the importance of being an unbiased price action trader to capitalize on market opportunities.
Sector rotation is nearing completion, potentially leading to a broad market rally as tech companies find support.
The speaker invites viewers to join his Discord server for trade ideas and intraday updates, highlighting the value of community in trading.
Transcripts
all right all right today I want to
start out looking at the Dow Jones and I
do want to ask the question is the
sector rotation finally complete or do
we have more sector rotation to come and
we will look at all of the charts
necessary to answer that and the first
thing I want to show you is the
Magnificent Seven tech stocks which I
call the mega cap Tech or the big Tech
got absolutely destroyed today and this
is the topic that I've been focusing on
during these video updates and
especially in the Discord server is that
there was no need to be looking at tech
stocks right now if you're a bull while
we have so many opportunities in other
sectors that are just now starting to
break out and if you were a bull in big
Tech today it was a very big blood bath
and if that's all you have on your watch
list you are probably thinking the
market is extremely bearish but that
could not be farther from the truth this
is all just money leaving the tech
companies and going into other sectors
which is very evident by the Dow Jones
going up .55% today to a brand new
all-time high blasting through that
price Target at 411 and Well on our way
towards the next price Target at 415 and
remember last night I upgraded my price
Target and I told you this was buy all
dips above 407 for the next price Target
at 4155 now again I'm not putting any
limits on how high the Dow Jones can go
if we break through 415 we'll be looking
for 420 and as I've told you before
there is a ton of buying volume on a
bull breakout and there's still a ton of
bears trying to short the Dow Jones so
so do not for one second think it can't
go higher it is likely going to continue
to go higher and there is no way with
the Dow Jones breaking out to brand new
all-time highs that we can say the
market is bearish so first things first
if you think the market is bearish that
is because you got caught in a sector
rotation out of tech and you only look
at tech stocks this is still a very
bullish Market it is just not a very
bullish market for tech companies right
now to further Hammer home this point
we're going to jump over to birkshire
hathway with once more was up
1.53% today making brand new all-time
highs and just continuing to go up in a
vertical line on all very decent buying
volume and again this is a multi-month
consolidation breakout of over 5 months
of going absolutely nowhere and that is
why this is such a bullish breakout so
when we're talking about is the sector
rotation completed the first thing we
need to look at is the sector that money
is leaving from so next we're going to
jump over to the triple q's and on the
triple Q's I did tell you I was not
bullish on this thing I was actually
looking for it to break down towards 478
but I do think I was a little too
aggressive on that downside there is a
good chance we could find support just a
bit higher than that and the other thing
I want to show you is that this was
broadcasted on the chart before it
happened and you can see right here in
the Discord server where I said the
triple Q's were likely going lower and
that some kind of news event was going
to take the credit for it there was no
news event that caused this to happen as
you can tell from this update on your
screen right now I called this before
before happened before I ever saw any
news this was 100% broadcasted on the
charts and this was 100% part of the
sector rotation theme that we've been
talking about so I want to spend some
extra time on the triple Q's today
because if this is the sector and this
is the index that money is leaving we
need to try to figure out when that
money is done leaving and when we are
likely going to find support and if we
look at the volume on the triple Q's
today we had very high volume selling as
we were expecting on a breakdown below
491 and we gap down below 491 which is a
breakaway Gap and when you get a
breakaway Gap below a risk level that is
a risk-off indication and that meant
there was a very good chance we were
going to 485 but I told you in the past
I didn't expect 485 to hold while that
was a good opportunity to get low-risk
long entries the real price Target that
we're looking for is closer to 478 to
480 so very quickly here I do think the
sector rotation is coming to a close and
the reason I believe that because we've
already seen a lot of the money leaving
the triple q's and sellers will get
exhausted down here near support so my
preferred scenario is that we are going
to find support somewhere between 478
and 480 and then try to bounce to close
this Gap up here right around 493 and
this is the scenario that I prefer but
as I always tell you you should be
prepared for all scenarios and there is
a scenario where this support fails and
we just come crashing down towards this
Gap fill at 468 and if you remember back
I told you this Gap fill was a 100%
guarantee that that it was going to fill
but we have no idea what time and what
time frame it's going to fill so it is
possible if we lose support here we just
continue to flush down and go close that
Gap now however what I prefer is that we
would go up here higher first and put in
another lower high and then from there
we could get another lower high
rejection and then come down and fill
that Gap in that scenario I think will
hurt the majority because a lot of
people will miss the rally higher as we
go up to close the gap as we're closing
the Gap there's a good chance they're
going to get bullish just in time for
another lower high rejection to fill
this Gap at 468 and the market does love
to fool and hurt the majority and that
could very well be What Hurts The
majority we're going to have to watch
the price from here to find out more
information and as always let the chart
do all the talking so the chart is doing
a ton of talking there is no denying
that this looks riskof although we are
at very strong support which could be a
sign to get risk onone but once more if
that support fails that is going to be
another riskof indicator that we're
likely going down towards 468 so if you
look at this rejection from an all-time
high and the lower high we were getting
the all-time highs in the S&P 500 and
the Dow Jones while the dech sector was
putting in a lower high and that is how
I was able to predict sector rotation
and the fact that the NASDAQ 100 was
looking weaker which meant we were
likely going to get that lower high
Rejection it was all on the chart and
the price action did all the talking all
I did was read the chart so that is what
I'm teaching you to do is read the price
action have no bias I couldn't care less
if we go higher or lower all I want to
do is make money and get the best risk
reward setups with the best probability
to win the trade and right now I cannot
deny that the Bulls have a damn good
chance to win here if they buy at this
support especially with that Gap fill
above and the Very powerful bull Trend
as long as we're above the support trend
line so 478 to 480 is a very critical
support if we break below it that is
another indication we're going a lot
lower so do be aware of that and watch
the price action and let it do all the
Talking next up we'll jump over to spy
and spy did get rejected from that
all-time high price Target at 564 we did
gap down so we have a gap up here at 562
and we did not get the riskof indication
so I'm going to redo some of these
arrows we got the pullback and we hit
the all-time high price Target so that
trade has completely worked out but what
we haven't yet seen is spy going to get
risk off and break 556 or are we just
going to get another higher low and
continue a bull Trend build the Gap at
562 and head higher towards 569 this is
very possible if the sector rotation is
complete and the tech sector starts to
get bought up while these other sectors
are going higher as well because you
have to remember the S&P 500 represents
multiple sectors which includes the
Industrials financials Healthcare and
Tech sector now there are other things
in the S&P 500 like energy but they are
very low weight so we're not even going
to talk about them but when we look at
the possibility that above 556 we can
make another brand new all-time high by
the end of the month this is another
indication that there's no reason to be
panicking and starting to freak out
unless we start to break down below 556
and even then you shouldn't be panicking
it should be part of your trade plan
that if we break support you're getting
risk off for a push down here towards
548 so I think spy is very simple risk
on above 556 risk off below it and do
not rule out the possibility this strong
bull Trend just continues to push higher
on the Russell 2000 iwm ETF we were down
1.05% today and we did hit the price
Target right around 226 and we were just
a little bit away from the price Target
at 228 which if I zoom out here and I
give you a bigger picture view that is
where I thought the small caps were
going and as of the intraday High we
were only about 8% away from it so we
were very close and we are still outside
this upper po underband so even if we do
get a pullback towards this support zone
between the Gap fill at 218 and the
breakout at 220 there's still a good
chance we're just going to continue to
push higher within this bull Trend and
hit the price Target so there's nothing
on these charts that tell me the market
is bearish if anything it's only
confirming that we had sector rotation
out of the tech companies and out of big
Tech into these other sectors if you
look at this chart these moving averages
are very positive sloping with lots of
Separation in a strong bull Trend which
tells us we're looking to buy dips in
iwm at strong support zones if we look
at the vix today we did finally get the
vix zone right around 15 which is what
we expect to see in the vix while we're
getting pullbacks and as long as we
don't see tons of panic and fear here
the vix is likely going to stay down
below 15 and Crush yet again which is
going to fuel another bull rally so
right now I'm going to give you one more
prediction that the vix is going to
crush and the vix is going to come back
down towards 13 and that is going to
fuel the balance that I'm expecting in
the indices next we'll look at Bitcoin
which is another good risk on indicator
and Bitcoin is holding above 64,000 and
if we hold above 64,000 we'll be looking
for 67,000 and I still think this is
risk on while we can hold this breakout
above 60,000 so from here we'll look at
xli in xli I did talk about this double
bottom breakout but more importantly now
that we're at all-time highs in xli we
have a bigger double bottom in play and
that is as long as we're above 126
there's a good chance we're going to see
buyers of the dip above 126 as we
continue to push higher towards 131 and
it's very hard to say that the market is
bearish if we're expecting new all-time
highs and very powerful bull Trends so
if you think the market is bearish it's
because you're only looking at tech
stocks there is nothing bearish about a
mega double bottom breakout that is
likely going much higher and the
industrial sector is going to favor the
Dow Jones if we look at the financial
sector which is XLF we did pushed
through my price Target at 43.5 and
we're continuing to push higher and
again these are not bearish indic ations
these are healthy for the market as a
whole which definitely includes the S&P
500 even if we continue to see weakness
in the tech companies there are still
stocks breaking out looking very bullish
and I want to talk about one of those
tonight which is Lockheed Martin ticker
symbol LMT which is just now starting to
break through this multi-week
consolidation where we've gone
absolutely nowhere except sideways and
we are just now starting to break out of
this range while we're above 471 which
means we could see another very powerful
push here and again there are are tons
of great trades in this market as long
as you know where to find them it's not
all necessarily going to continue to be
in those tech companies that you're used
to trading and that you're used to
everybody talking about there are other
stocks in the stock market and this is
one of them that is starting to look
bullish and also if you look at this
multi-week consolidation breakout it is
all happening on higher lows and now
higher highs so again there is nothing
bearish about the market right now there
are only sectors of the market that are
seeing selling in favor of buying others
so I don't want to make this video too
winded or too long so we'll jump back
over the S&P 500 and I'll just Hammer
home the point one more time this was a
sector rotation we were all over it from
the beginning and I told you exactly
everything you should be looking for and
what you should be trading and I even
suggested that you sideline those tech
companies so that is all now playing out
and there's a good chance now that it's
playing out that it could also be near
completion which means those tech
companies could find support and
continue this bull rally and we could
get an everything rally which is
extremely bullish for the whole entire
Market before we had a very narrow
breath bull market that the Magnificent
7 tech companies were pushing spy in the
triple Q's higher but now we're seeing
participation from the small caps and
the Dow Jones as well as many other
sectors like Industrials and financials
and Healthcare and Healthcare is another
one of those sectors that was going
higher today continuing to push and
break out bullishly that we didn't even
look at and of course there's going to
be plenty of other stocks and trade
ideas in the Discord server highlighting
the sector rotation theme so remember
the market is still bullish don't get
bamboozled and don't get get tricked
into thinking the market is bearish just
because tech companies are going lower
tech companies are a very important part
of the market but they have had a very
strong bull rally and they are just now
cooling down and once they're done
cooling down they could continue to go
higher and this bull rally can and
likely will continue to live on so no
matter what you're doing manage a risk
at critical support and make sure you
have a trade plan prepared for either
scenario and let the price action on the
chart do all the Talking be an unbiased
price action Trader and you are going to
be very profitable in this market so if
you want access to all of my trade ideas
that's going to be in my Discord server
and you'll also get access to my
intraday updates and all of my technical
analysis and you can find out how to
join my Discord server by clicking on
the link in the description of this
video so thank you for watching
everybody I hope you're crushing this
market and as always I will see you in
the next episode
5.0 / 5 (0 votes)