Find WINNING Chart Patterns With Just One Click! (This Is Unfair…..)
Summary
TLDRThis video explains how automated pattern recognition in trading can save time, improve accuracy, and help traders spot key chart patterns they might otherwise miss. It covers various chart patterns like symmetrical triangles, ascending and descending triangles, and head-and-shoulders, demonstrating how each one signals potential market movements. The video also highlights the benefits of using Mumu, a trading platform that automates pattern identification, making it easier for both experienced and novice traders to analyze charts, execute trades, and access low-fee services. Viewers are encouraged to explore advanced trading strategies and tools offered by the platform.
Takeaways
- 😀 Automated pattern detection helps save time and improve trading accuracy by identifying chart patterns that might otherwise be missed.
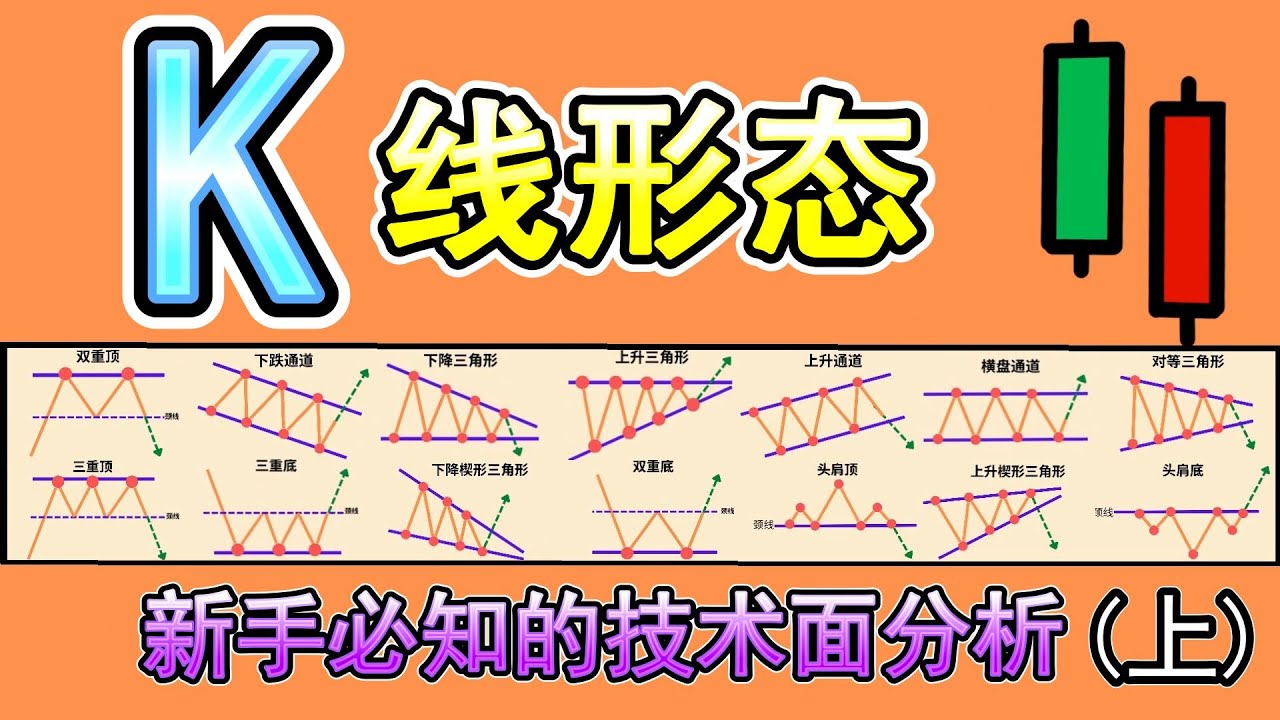
- 😀 The symmetrical triangle pattern signals a potential upward or downward move once the price breaks above or below the pattern.
- 😀 The ascending triangle pattern suggests a bullish move if the price breaks above the resistance level.
- 😀 The descending triangle pattern indicates a bearish move if the price breaks below the support level.
- 😀 The rising wedge pattern signals a possible upward move when price breaks above the pattern, but a downside move when price breaks below.
- 😀 The falling wedge pattern suggests a bullish move when price breaks above the pattern after a downward trend.
- 😀 The bullish and bearish flag patterns signal trend continuation in the direction of the existing trend once price breaks out of the flag formation.
- 😀 Double top and double bottom patterns are reversal patterns that indicate a potential shift in trend direction when price breaks above or below the neckline.
- 😀 The head and shoulders pattern is a strong reversal signal, where a break below the neckline suggests a potential bearish move.
- 😀 Mumu, the trading platform, automatically detects chart patterns and offers a seamless trading experience with low fees, real-time data, and commission-free trades.
Q & A
What is the primary benefit of using chart patterns in trading?
-Chart patterns help traders identify potential price movements, improving trade accuracy and saving time by spotting patterns that might otherwise be missed.
What is the symmetrical triangle pattern and how do traders use it?
-The symmetrical triangle pattern consists of two converging trend lines. Traders enter long when price breaks above the pattern, signaling an upward move, or on a pullback. If price breaks below, it signals a potential downward move.
How does the ascending triangle pattern differ from the symmetrical triangle?
-The ascending triangle pattern has a horizontal resistance level at the top and an upward sloping trend line below. It signals a potential upward move when price breaks above the resistance level, similar to the symmetrical triangle but with a focus on a stronger horizontal resistance.
What is the importance of identifying support and resistance levels in trading patterns?
-Support and resistance levels are crucial as they help identify key price points where trends might reverse or continue, allowing traders to plan entries and exits effectively.
What does a rising wedge pattern indicate?
-A rising wedge pattern occurs when two converging trend lines slope upwards. If price breaks above the pattern, it could signal a move upwards. However, if price breaks below, it signals a potential downward move.
Why are flags, such as the bullish and bearish flag patterns, important in technical analysis?
-Flags indicate a pause or consolidation in a prevailing trend. A bullish flag follows an upward trend, signaling continuation when the pattern breaks above, while a bearish flag signals continuation downward when it breaks below.
What is the role of Mumu's automated pattern recognition feature?
-Mumu's automated pattern recognition feature saves time by identifying chart patterns for traders. It helps find patterns such as the double bottom, bullish continuation triangle, and rising wedge, allowing traders to make informed decisions faster.
How can traders use the Mumu platform's indicators to enhance their analysis?
-Traders can overlay indicators such as the Ichimoku Cloud, Bollinger Bands, and EMAs on the charts to further analyze price movements and improve their decision-making process.
What is the significance of the double bottom and double top patterns in identifying trend reversals?
-The double bottom pattern signals a potential bullish reversal when price fails to make a lower low. The double top pattern signals a potential bearish reversal when price fails to make a higher high. Both patterns indicate a loss of momentum from the previous trend.
How does Mumu's platform assist with trading once a pattern is identified?
-Once a pattern is identified, Mumu’s platform allows traders to directly enter trades through the 'Quick Trade' feature. They can buy and sell assets seamlessly, with access to live data, low commission, and real-time trading capabilities.
Outlines

This section is available to paid users only. Please upgrade to access this part.
Upgrade NowMindmap

This section is available to paid users only. Please upgrade to access this part.
Upgrade NowKeywords

This section is available to paid users only. Please upgrade to access this part.
Upgrade NowHighlights

This section is available to paid users only. Please upgrade to access this part.
Upgrade NowTranscripts

This section is available to paid users only. Please upgrade to access this part.
Upgrade NowBrowse More Related Video
【K线形态 技术面分析】(上)你必知的18种K线形态完整教学|K线形态交易策略大公开|技术分析新手入门教学|专业交易员必备的K线形态技术分析|Chart Pattern Analysis

The BEST Guide to CHART PATTERNS Price Action

Technical Analysis Tutorial for Beginners (13 Best Crypto TA Tips)

ICT/SMC Market Structure Full Guide Simplified | CHoCH & BOS Secrets

🔥 MMC Phase 13 | TIMEFRAME ANALYSIS ( Part 2 )

Padrões de Reversão
5.0 / 5 (0 votes)