How economic inequality harms societies | Richard Wilkinson

TED
24 Oct 201116:55

Summary

TLDRThe speaker discusses the detrimental effects of income inequality on societal well-being, using data from various countries to illustrate the correlation between greater inequality and a range of social issues, including health disparities, crime, and lack of social mobility. Emphasizing the psychosocial impacts of relative income and status, the talk highlights that even the affluent suffer in more unequal societies, advocating for policies that reduce income gaps to enhance overall societal health and function.

Takeaways

  • πŸ“Š Inequality has a significant impact on societies, with more unequal countries facing a wide range of social problems, despite having no correlation with national income per capita.
  • 🌍 The comparison of societies with varying levels of inequality shows that relative income and social status within societies are more important than the average income of a country.
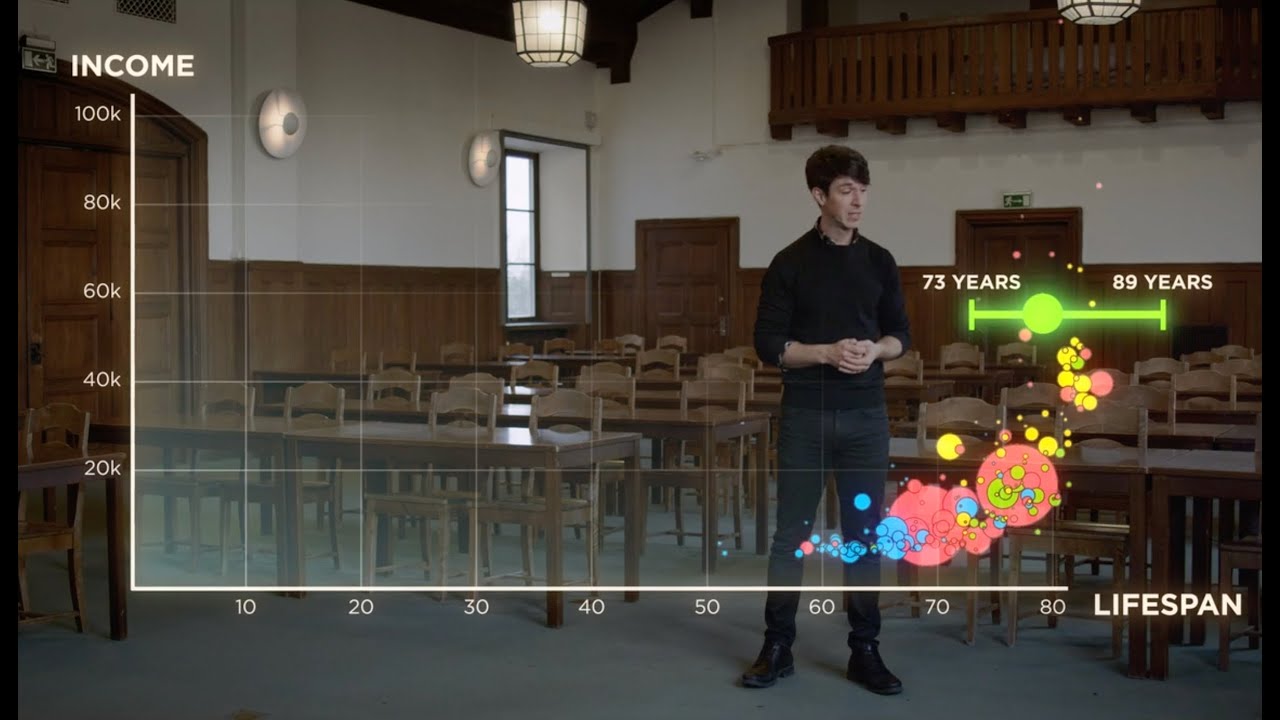
  • πŸ“ˆ Within societies, there are noticeable health gradients, with life expectancy and other health indicators varying significantly between the richest and poorest areas.
  • 🧩 The paradox of no correlation between national income and life expectancy globally, but a clear gradient within societies, suggests that relative wealth matters more than absolute wealth.
  • πŸ” The speaker uses data from the U.N. and World Bank to illustrate the scale of income differences and their effects on societal well-being.
  • πŸ“‰ More unequal societies tend to have worse outcomes in areas such as life expectancy, education, crime, and mental health, compared to more equal societies.
  • πŸ‘Ά UNICEF's index of child well-being also shows a significant relationship with inequality, indicating that children fare worse in more unequal societies.
  • 🀝 Trust levels in a society are closely related to its level of inequality, with higher trust found in more equal societies.
  • πŸ₯ Mental illness rates are higher in more unequal societies, reflecting the psychosocial effects of inequality on individuals.
  • πŸš‘ Violence and imprisonment rates are also linked to inequality, with more unequal societies experiencing higher levels of these issues.
  • πŸ’Ό Social mobility is greater in more equal societies, suggesting that a person's economic prospects are less determined by their parents' income.

Q & A

  • What is the main argument presented in the script about inequality?

    -The script argues that inequality is not only divisive and socially corrosive but also has a significant impact on various social problems within societies. It suggests that more equal societies tend to fare better in terms of health, education, and social issues compared to more unequal ones.

  • How does the script use the concept of 'relative income' to explain the paradox of life expectancy?

    -The script explains that while there is no significant difference in life expectancy between rich and poor countries, there are stark differences within societies. It suggests that 'relative income' or social position is more important within societies, indicating that how individuals are positioned relative to each other matters more for health outcomes than the overall wealth of a country.

  • What measure of income inequality is used in the script to compare different countries?

    -The script uses the measure of how much richer the top 20 percent is compared to the bottom 20 percent in each country, as an easy-to-understand metric to compare income inequality across different societies.

  • What is the correlation between income inequality and the various social problems presented in the script?

    -The script shows a strong correlation between income inequality and a range of social problems, including life expectancy, children's educational outcomes, infant mortality rates, crime rates, and social mobility. More unequal societies tend to have worse outcomes in these areas.

  • How does the script address the concern that the presented data might be cherry-picked to support a particular argument?

    -The script assures that the data presented is not cherry-picked. It states that if a data source has data for one of the countries being studied, it is included in the analysis, with the data source determining the reliability of the data, not the researchers.

  • What is the significance of the UNICEF index of child well-being in the context of the script?

    -The UNICEF index of child well-being, which includes 40 different components, is used in the script to further validate the argument that more unequal societies have worse outcomes for children, regardless of the country's per capita income.

  • How does the script differentiate between the effects of inequality on different social classes?

    -The script suggests that while the negative effects of inequality are most pronounced at the bottom of the social hierarchy, there are benefits to being in a more equal society even at the top, indicating that greater equality has a positive impact across the entire social spectrum.

  • What role does the script suggest that psychosocial effects play in the outcomes of inequality?

    -The script posits that the psychosocial effects of inequality, such as feelings of superiority and inferiority, respect and disrespect, as well as status competition, contribute significantly to the social problems observed in more unequal societies.

  • How does the script discuss the issue of causality in the relationship between inequality and social problems?

    -While acknowledging that correlation does not prove causality, the script discusses various studies and mechanisms, such as the impact of chronic stress on health and the sensitivity to social judgments, that suggest a causal link between inequality and the social problems observed.

  • What solutions or approaches does the script propose to address the issues related to inequality?

    -The script suggests that both pre-tax and post-tax measures are needed to address inequality. It calls for constraining top incomes, such as bonus culture incomes, and making bosses accountable to their employees, with the ultimate goal of improving the quality of human life by reducing income disparities.

  • How does the script compare the approaches of Sweden and Japan in achieving greater equality?

    -The script highlights that Sweden achieves greater equality through significant differences in earnings, which are then narrowed through taxation and a robust welfare state, while Japan starts with smaller differences in pre-tax earnings and has lower taxes and a smaller welfare state. It concludes that the method of achieving greater equality is less important than the fact of achieving it.

Outlines

00:00

πŸ“Š Inequality's Impact on Society and Health

The speaker begins by discussing the historical intuition that inequality is socially divisive and introduces evidence to compare the effects of inequality within societies rather than between them. They present data showing no correlation between national income and life expectancy, contrasting it with significant social gradients in health within countries. The paradox is explained by the impact of relative income and social status. The speaker then compares income disparities in developed countries, using U.N. data to illustrate the scale of income differences and their correlation with various social problems, such as life expectancy, education, crime, and trust. The summary of an index of social problems reveals a strong correlation with income inequality, not with national income per capita.

05:01

πŸ” The Correlation Between Inequality and Social Trust

This paragraph delves into the effects of inequality on social trust and community involvement, using data from the World Values Survey. It highlights a stark contrast between the trust levels in more unequal societies, where only about 15% of the population trusts others, compared to 60-65% in more equal societies. The speaker also discusses the relationship between inequality and mental illness, violence, imprisonment rates, and high school dropout rates, drawing on data from the WHO and other sources. The findings from the 50 American states mirror those of developed countries, reinforcing the link between inequality and a range of social issues. The paragraph concludes with a humorous note about the American dream being more attainable in Denmark, given its higher social mobility.

10:03

🌐 The Effects of Inequality Beyond Economic Measures

The speaker explores the differences in achieving greater equality between countries like Sweden and Japan, emphasizing that the method of achieving equality is less important than the outcome itself. They discuss the psychosocial effects of inequality, including feelings of superiority and inferiority, and the impact on consumerism and status insecurity. Studies are cited that link social-evaluative threats to increased cortisol levels, indicating the physiological effects of social stress. The speaker defends their methodology against criticism, stating that they do not selectively choose data and that their findings are supported by a wealth of academic research.

15:04

πŸ›  Addressing Inequality for Improved Social Well-being

In the final paragraph, the speaker addresses the question of causality, acknowledging that correlation does not prove causation but pointing to well-understood causal links in certain outcomes, such as the impact of chronic stress on health. They argue for the need to tackle both pre-tax and post-tax income disparities, suggesting ways to make bosses accountable to employees. The speaker concludes with a hopeful message that by reducing income inequality, we can improve the psychosocial well-being of societies, offering a clear strategy for enhancing the quality of human life.

Mindmap

Keywords

πŸ’‘Inequality

Inequality refers to the uneven distribution of resources, opportunities, and wealth within a society. It is a central theme in the video, as the speaker discusses how greater inequality correlates with a wide range of social problems. For example, the speaker mentions that more unequal countries have worse outcomes in terms of life expectancy, social mobility, and trust among other metrics.

πŸ’‘Social gradients

Social gradients describe the differences in health and well-being that exist across different socioeconomic levels within a society. In the video, the speaker uses the term to illustrate how health and life expectancy vary significantly among different income groups within countries, with those at the lower end of the social spectrum facing worse outcomes.

πŸ’‘Life expectancy

Life expectancy is the average number of years a person is expected to live, often used as an indicator of a population's health. The video emphasizes the stark differences in life expectancy between the richest and poorest within societies, highlighting the impact of inequality on this measure of public health.

πŸ’‘Gross national income

Gross national income (GNI) is a measure of a country's total economic output, adjusted for its population size. The speaker contrasts the lack of correlation between a country's GNI and its life expectancy with the significant social gradients in health within countries, suggesting that relative income matters more than average wealth.

πŸ’‘Social status

Social status refers to an individual's position within a particular social hierarchy. The video discusses how relative social status, or where individuals stand in comparison to others, influences their health and well-being, and how this is more significant than absolute income levels.

πŸ’‘Correlation

Correlation in the context of the video refers to a statistical relationship between two variables, such as the relationship between a country's level of inequality and various social problems. The speaker presents data showing a strong correlation between higher inequality and worse social outcomes across different societies.

πŸ’‘Social problems

Social problems are issues that negatively impact the well-being of individuals and communities. The video compiles various social issues such as infant mortality rates, homicide rates, obesity, and mental illness into an index to demonstrate how these problems are exacerbated in more unequal societies.

πŸ’‘Trust

Trust, as discussed in the video, is the extent to which people believe that others can be relied upon. It is used as an indicator of social cohesion and is shown to be significantly lower in more unequal societies, reflecting a lack of social capital and community bonds.

πŸ’‘Social mobility

Social mobility refers to the ability of individuals to move between different social and economic positions within a society. The video argues that greater inequality hinders social mobility, as evidenced by the stronger link between a parent's income and a child's future income in more unequal countries.

πŸ’‘Psychosocial effects

Psychosocial effects are the impacts of social factors on an individual's psychological well-being. The speaker suggests that inequality has psychosocial effects, such as increased stress and status anxiety, which can contribute to a range of health issues and social problems.

πŸ’‘Consumerism

Consumerism is the idea that acquiring goods and services is the primary indicator of success and happiness. The video posits that feelings of inferiority and superiority stemming from inequality drive consumerism, as people seek to elevate their social status through material possessions.

Highlights

Inequality is divisive and socially corrosive, a notion that predates the French Revolution but is now supported by empirical evidence.

Life expectancy is not correlated with a country's gross national income, but social gradients in health are evident within societies.

Relative income or social status within a society has a significant impact on health and life expectancy, unlike the absolute wealth of a nation.

Data from the U.N. and World Bank shows a clear link between income inequality and various social problems.

More equal societies, such as Japan, Finland, Norway, and Sweden, have a higher life expectancy and better social outcomes compared to more unequal ones.

An index of social problems, including life expectancy, education, crime, and health, shows a strong negative correlation with income inequality.

The UNICEF index of child well-being also correlates negatively with income inequality, independent of national income per capita.

Greater income equality is associated with higher levels of trust and social capital within societies.

Mental illness rates are significantly higher in more unequal societies, as are rates of violence and imprisonment.

High school dropout rates and social mobility are also influenced by the level of income inequality in a society.

The American dream is more attainable in Denmark, a country with greater income equality.

Inequality affects not only the poor but also those at higher levels of the social hierarchy in various detrimental ways.

The psychosocial effects of inequality, such as status competition and insecurity, drive consumerism and stress.

Studies show that social-evaluative threats significantly raise stress hormone levels, impacting physical health.

The research methodology avoids bias by including all available data from reliable sources without selection.

Addressing inequality requires both pre-tax measures, such as constraining high incomes, and post-tax measures like progressive taxation.

Reducing income disparities can improve the psychosocial well-being and the real quality of life for societies as a whole.

Transcripts

play00:15

You all know the truth of what I'm going to say.

play00:18

I think the intuition that inequality is divisive and socially corrosive

play00:22

has been around since before the French Revolution.

play00:26

What's changed

play00:28

is we now can look at the evidence,

play00:30

we can compare societies, more and less equal societies,

play00:33

and see what inequality does.

play00:36

I'm going to take you through that data

play00:39

and then explain why

play00:41

the links I'm going to be showing you exist.

play00:45

But first, see what a miserable lot we are.

play00:48

(Laughter)

play00:50

I want to start though

play00:52

with a paradox.

play00:55

This shows you life expectancy

play00:57

against gross national income --

play00:59

how rich countries are on average.

play01:01

And you see the countries on the right,

play01:03

like Norway and the USA,

play01:05

are twice as rich as Israel, Greece, Portugal on the left.

play01:10

And it makes no difference to their life expectancy at all.

play01:14

There's no suggestion of a relationship there.

play01:16

But if we look within our societies,

play01:19

there are extraordinary social gradients in health

play01:22

running right across society.

play01:24

This, again, is life expectancy.

play01:26

These are small areas of England and Wales --

play01:28

the poorest on the right, the richest on the left.

play01:32

A lot of difference between the poor and the rest of us.

play01:35

Even the people just below the top

play01:37

have less good health

play01:39

than the people at the top.

play01:41

So income means something very important

play01:43

within our societies,

play01:45

and nothing between them.

play01:48

The explanation of that paradox

play01:51

is that, within our societies,

play01:53

we're looking at relative income

play01:55

or social position, social status --

play01:58

where we are in relation to each other

play02:01

and the size of the gaps between us.

play02:04

And as soon as you've got that idea,

play02:06

you should immediately wonder:

play02:08

what happens if we widen the differences,

play02:11

or compress them,

play02:13

make the income differences bigger or smaller?

play02:15

And that's what I'm going to show you.

play02:18

I'm not using any hypothetical data.

play02:20

I'm taking data from the U.N. --

play02:22

it's the same as the World Bank has --

play02:24

on the scale of income differences

play02:26

in these rich developed market democracies.

play02:29

The measure we've used,

play02:31

because it's easy to understand and you can download it,

play02:33

is how much richer the top 20 percent

play02:35

than the bottom 20 percent in each country.

play02:38

And you see in the more equal countries on the left --

play02:41

Japan, Finland, Norway, Sweden --

play02:43

the top 20 percent are about three and a half, four times as rich

play02:45

as the bottom 20 percent.

play02:48

But on the more unequal end --

play02:50

U.K., Portugal, USA, Singapore --

play02:52

the differences are twice as big.

play02:55

On that measure, we are twice as unequal

play02:58

as some of the other successful market democracies.

play03:02

Now I'm going to show you what that does to our societies.

play03:06

We collected data on problems with social gradients,

play03:09

the kind of problems that are more common

play03:11

at the bottom of the social ladder.

play03:13

Internationally comparable data on life expectancy,

play03:16

on kids' maths and literacy scores,

play03:19

on infant mortality rates, homicide rates,

play03:22

proportion of the population in prison, teenage birthrates,

play03:25

levels of trust,

play03:27

obesity, mental illness --

play03:29

which in standard diagnostic classification

play03:32

includes drug and alcohol addiction --

play03:34

and social mobility.

play03:36

We put them all in one index.

play03:39

They're all weighted equally.

play03:41

Where a country is is a sort of average score on these things.

play03:44

And there, you see it

play03:46

in relation to the measure of inequality I've just shown you,

play03:49

which I shall use over and over again in the data.

play03:52

The more unequal countries

play03:54

are doing worse

play03:56

on all these kinds of social problems.

play03:58

It's an extraordinarily close correlation.

play04:01

But if you look at that same index

play04:03

of health and social problems

play04:05

in relation to GNP per capita,

play04:07

gross national income,

play04:09

there's nothing there,

play04:11

no correlation anymore.

play04:14

We were a little bit worried

play04:16

that people might think

play04:18

we'd been choosing problems to suit our argument

play04:20

and just manufactured this evidence,

play04:23

so we also did a paper in the British Medical Journal

play04:26

on the UNICEF index of child well-being.

play04:30

It has 40 different components

play04:32

put together by other people.

play04:34

It contains whether kids can talk to their parents,

play04:37

whether they have books at home,

play04:39

what immunization rates are like, whether there's bullying at school.

play04:42

Everything goes into it.

play04:44

Here it is in relation to that same measure of inequality.

play04:48

Kids do worse in the more unequal societies.

play04:51

Highly significant relationship.

play04:54

But once again,

play04:56

if you look at that measure of child well-being,

play04:59

in relation to national income per person,

play05:01

there's no relationship,

play05:03

no suggestion of a relationship.

play05:06

What all the data I've shown you so far says

play05:09

is the same thing.

play05:11

The average well-being of our societies

play05:13

is not dependent any longer

play05:16

on national income and economic growth.

play05:19

That's very important in poorer countries,

play05:21

but not in the rich developed world.

play05:24

But the differences between us

play05:26

and where we are in relation to each other

play05:28

now matter very much.

play05:31

I'm going to show you some of the separate bits of our index.

play05:34

Here, for instance, is trust.

play05:36

It's simply the proportion of the population

play05:38

who agree most people can be trusted.

play05:40

It comes from the World Values Survey.

play05:42

You see, at the more unequal end,

play05:44

it's about 15 percent of the population

play05:47

who feel they can trust others.

play05:49

But in the more equal societies,

play05:51

it rises to 60 or 65 percent.

play05:55

And if you look at measures of involvement in community life

play05:58

or social capital,

play06:00

very similar relationships

play06:02

closely related to inequality.

play06:05

I may say, we did all this work twice.

play06:08

We did it first on these rich, developed countries,

play06:11

and then as a separate test bed,

play06:13

we repeated it all on the 50 American states --

play06:16

asking just the same question:

play06:18

do the more unequal states

play06:20

do worse on all these kinds of measures?

play06:22

So here is trust from a general social survey of the federal government

play06:26

related to inequality.

play06:28

Very similar scatter

play06:30

over a similar range of levels of trust.

play06:32

Same thing is going on.

play06:34

Basically we found

play06:36

that almost anything that's related to trust internationally

play06:39

is related to trust amongst the 50 states

play06:41

in that separate test bed.

play06:43

We're not just talking about a fluke.

play06:45

This is mental illness.

play06:47

WHO put together figures

play06:49

using the same diagnostic interviews

play06:51

on random samples of the population

play06:53

to allow us to compare rates of mental illness

play06:56

in each society.

play06:58

This is the percent of the population

play07:00

with any mental illness in the preceding year.

play07:03

And it goes from about eight percent

play07:06

up to three times that --

play07:08

whole societies

play07:10

with three times the level of mental illness of others.

play07:13

And again, closely related to inequality.

play07:17

This is violence.

play07:19

These red dots are American states,

play07:21

and the blue triangles are Canadian provinces.

play07:25

But look at the scale of the differences.

play07:28

It goes from 15 homicides per million

play07:31

up to 150.

play07:34

This is the proportion of the population in prison.

play07:37

There's a about a tenfold difference there,

play07:40

log scale up the side.

play07:42

But it goes from about 40 to 400

play07:44

people in prison.

play07:47

That relationship

play07:49

is not mainly driven by more crime.

play07:51

In some places, that's part of it.

play07:54

But most of it is about more punitive sentencing,

play07:56

harsher sentencing.

play07:58

And the more unequal societies

play08:00

are more likely also to retain the death penalty.

play08:04

Here we have children dropping out of high school.

play08:09

Again, quite big differences.

play08:11

Extraordinarily damaging,

play08:13

if you're talking about using the talents of the population.

play08:16

This is social mobility.

play08:19

It's actually a measure of mobility

play08:21

based on income.

play08:23

Basically, it's asking:

play08:25

do rich fathers have rich sons

play08:27

and poor fathers have poor sons,

play08:29

or is there no relationship between the two?

play08:32

And at the more unequal end,

play08:34

fathers' income is much more important --

play08:37

in the U.K., USA.

play08:40

And in Scandinavian countries,

play08:42

fathers' income is much less important.

play08:44

There's more social mobility.

play08:47

And as we like to say --

play08:49

and I know there are a lot of Americans in the audience here --

play08:52

if Americans want to live the American dream,

play08:55

they should go to Denmark.

play08:57

(Laughter)

play08:59

(Applause)

play09:03

I've shown you just a few things in italics here.

play09:06

I could have shown a number of other problems.

play09:08

They're all problems that tend to be more common

play09:10

at the bottom of the social gradient.

play09:12

But there are endless problems with social gradients

play09:17

that are worse in more unequal countries --

play09:19

not just a little bit worse,

play09:21

but anything from twice as common to 10 times as common.

play09:24

Think of the expense,

play09:26

the human cost of that.

play09:29

I want to go back though to this graph that I showed you earlier

play09:31

where we put it all together

play09:33

to make two points.

play09:35

One is that, in graph after graph,

play09:38

we find the countries that do worse,

play09:40

whatever the outcome,

play09:42

seem to be the more unequal ones,

play09:44

and the ones that do well

play09:46

seem to be the Nordic countries and Japan.

play09:49

So what we're looking at

play09:51

is general social disfunction related to inequality.

play09:54

It's not just one or two things that go wrong,

play09:56

it's most things.

play09:58

The other really important point I want to make on this graph

play10:01

is that, if you look at the bottom,

play10:03

Sweden and Japan,

play10:06

they're very different countries in all sorts of ways.

play10:09

The position of women,

play10:11

how closely they keep to the nuclear family,

play10:13

are on opposite ends of the poles

play10:15

in terms of the rich developed world.

play10:17

But another really important difference

play10:19

is how they get their greater equality.

play10:22

Sweden has huge differences in earnings,

play10:25

and it narrows the gap through taxation,

play10:27

general welfare state,

play10:29

generous benefits and so on.

play10:32

Japan is rather different though.

play10:34

It starts off with much smaller differences in earnings before tax.

play10:37

It has lower taxes.

play10:39

It has a smaller welfare state.

play10:41

And in our analysis of the American states,

play10:43

we find rather the same contrast.

play10:45

There are some states that do well through redistribution,

play10:48

some states that do well

play10:50

because they have smaller income differences before tax.

play10:53

So we conclude

play10:55

that it doesn't much matter how you get your greater equality,

play10:58

as long as you get there somehow.

play11:00

I am not talking about perfect equality,

play11:02

I'm talking about what exists in rich developed market democracies.

play11:08

Another really surprising part of this picture

play11:13

is that it's not just the poor

play11:15

who are affected by inequality.

play11:18

There seems to be some truth in John Donne's

play11:20

"No man is an island."

play11:23

And in a number of studies, it's possible to compare

play11:26

how people do in more and less equal countries

play11:29

at each level in the social hierarchy.

play11:32

This is just one example.

play11:35

It's infant mortality.

play11:37

Some Swedes very kindly classified a lot of their infant deaths

play11:40

according to the British register of general socioeconomic classification.

play11:45

And so it's anachronistically

play11:48

a classification by fathers' occupations,

play11:50

so single parents go on their own.

play11:52

But then where it says "low social class,"

play11:55

that's unskilled manual occupations.

play11:58

It goes through towards the skilled manual occupations in the middle,

play12:02

then the junior non-manual,

play12:04

going up high to the professional occupations --

play12:07

doctors, lawyers,

play12:09

directors of larger companies.

play12:11

You see there that Sweden does better than Britain

play12:14

all the way across the social hierarchy.

play12:19

The biggest differences are at the bottom of society.

play12:21

But even at the top,

play12:23

there seems to be a small benefit

play12:25

to being in a more equal society.

play12:27

We show that on about five different sets of data

play12:30

covering educational outcomes

play12:32

and health in the United States and internationally.

play12:35

And that seems to be the general picture --

play12:38

that greater equality makes most difference at the bottom,

play12:41

but has some benefits even at the top.

play12:44

But I should say a few words about what's going on.

play12:48

I think I'm looking and talking

play12:50

about the psychosocial effects of inequality.

play12:53

More to do with feelings of superiority and inferiority,

play12:56

of being valued and devalued,

play12:58

respected and disrespected.

play13:01

And of course, those feelings

play13:03

of the status competition that comes out of that

play13:06

drives the consumerism in our society.

play13:09

It also leads to status insecurity.

play13:12

We worry more about how we're judged and seen by others,

play13:16

whether we're regarded as attractive, clever,

play13:19

all that kind of thing.

play13:22

The social-evaluative judgments increase,

play13:25

the fear of those social-evaluative judgments.

play13:29

Interestingly,

play13:31

some parallel work going on in social psychology:

play13:35

some people reviewed 208 different studies

play13:38

in which volunteers had been invited

play13:41

into a psychological laboratory

play13:43

and had their stress hormones,

play13:45

their responses to doing stressful tasks, measured.

play13:49

And in the review,

play13:51

what they were interested in seeing

play13:53

is what kind of stresses

play13:55

most reliably raise levels of cortisol,

play13:58

the central stress hormone.

play14:00

And the conclusion was

play14:02

it was tasks that included social-evaluative threat --

play14:05

threats to self-esteem or social status

play14:08

in which others can negatively judge your performance.

play14:11

Those kind of stresses

play14:13

have a very particular effect

play14:16

on the physiology of stress.

play14:20

Now we have been criticized.

play14:22

Of course, there are people who dislike this stuff

play14:25

and people who find it very surprising.

play14:28

I should tell you though

play14:30

that when people criticize us for picking and choosing data,

play14:33

we never pick and choose data.

play14:35

We have an absolute rule

play14:37

that if our data source has data for one of the countries we're looking at,

play14:40

it goes into the analysis.

play14:42

Our data source decides

play14:44

whether it's reliable data,

play14:46

we don't.

play14:48

Otherwise that would introduce bias.

play14:50

What about other countries?

play14:52

There are 200 studies

play14:55

of health in relation to income and equality

play14:58

in the academic peer-reviewed journals.

play15:01

This isn't confined to these countries here,

play15:04

hiding a very simple demonstration.

play15:06

The same countries,

play15:08

the same measure of inequality,

play15:10

one problem after another.

play15:14

Why don't we control for other factors?

play15:16

Well we've shown you that GNP per capita

play15:18

doesn't make any difference.

play15:20

And of course, others using more sophisticated methods in the literature

play15:24

have controlled for poverty and education

play15:26

and so on.

play15:30

What about causality?

play15:32

Correlation in itself doesn't prove causality.

play15:35

We spend a good bit of time.

play15:37

And indeed, people know the causal links quite well

play15:39

in some of these outcomes.

play15:41

The big change in our understanding

play15:43

of drivers of chronic health

play15:45

in the rich developed world

play15:47

is how important chronic stress from social sources

play15:51

is affecting the immune system,

play15:53

the cardiovascular system.

play15:56

Or for instance, the reason why violence

play15:58

becomes more common in more unequal societies

play16:01

is because people are sensitive to being looked down on.

play16:06

I should say that to deal with this,

play16:09

we've got to deal with the post-tax things

play16:11

and the pre-tax things.

play16:13

We've got to constrain income,

play16:16

the bonus culture incomes at the top.

play16:18

I think we must make our bosses accountable to their employees

play16:21

in any way we can.

play16:24

I think the take-home message though

play16:27

is that we can improve the real quality of human life

play16:31

by reducing the differences in incomes between us.

play16:34

Suddenly we have a handle

play16:36

on the psychosocial well-being of whole societies,

play16:38

and that's exciting.

play16:40

Thank you.

play16:42

(Applause)

Rate This
β˜…
β˜…
β˜…
β˜…
β˜…

5.0 / 5 (0 votes)

Related Tags
Income InequalitySocial ImpactHealth DisparitiesEconomic GrowthSocioeconomic StatusQuality of LifeSocial GradientMental HealthCommunity TrustSocial MobilityConsumerism