Mencari nilai Z Tabel (Z alfa perdua)
Summary
TLDRThis video explains how to determine the critical Z-value (Z tabel) used in hypothesis testing, particularly in large sample sizes. The speaker demonstrates how to calculate the Z-value using a significance level (alpha), and how to use a Z-table to find the corresponding Z critical value. With a focus on two-tailed tests, the explanation covers how to interpret the Z-value, compare it with the test statistic, and decide whether to reject the null hypothesis. The tutorial is aimed at helping students grasp the concept of Z-tests and critical values in statistical analysis.
Takeaways
- 😀 Z-table and critical Z-values are essential for hypothesis testing in statistics.
- 😀 The Z-table value depends on the significance level (alpha), not the calculated Z-value.
- 😀 To find the Z-table value, divide alpha by 2 (for a two-tailed test) and find the corresponding area.
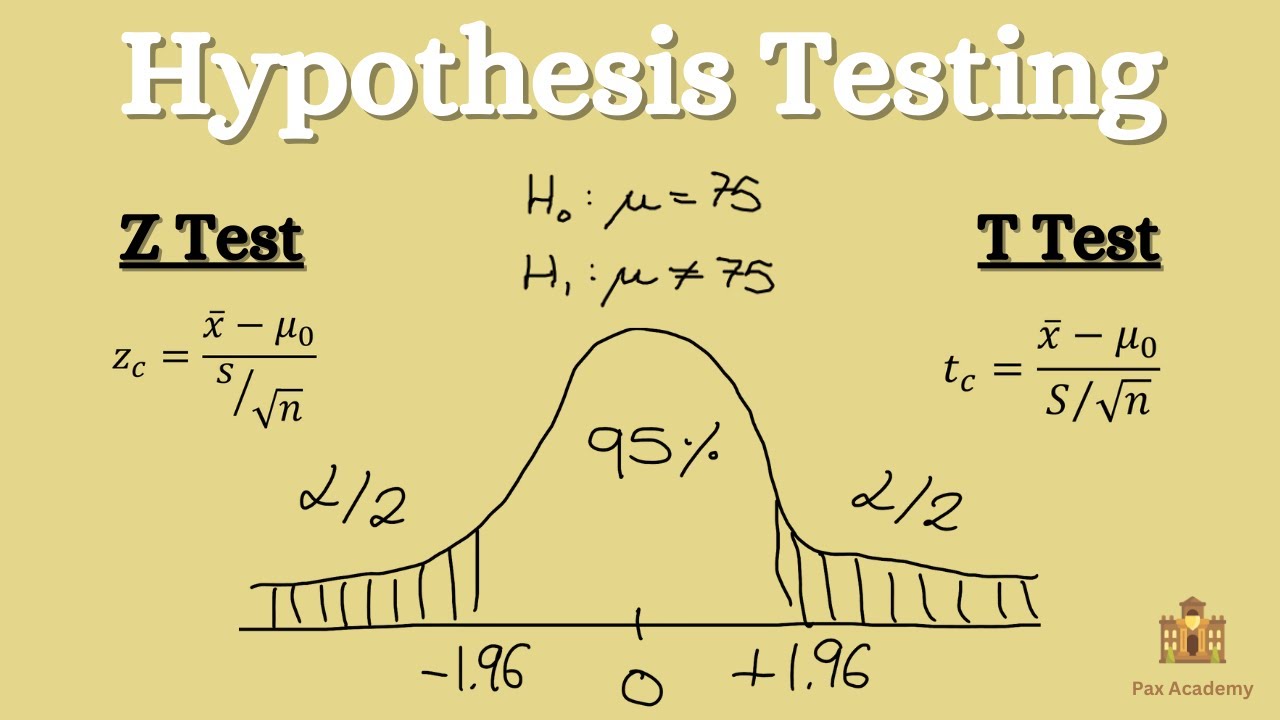
- 😀 For an alpha level of 5%, divide it by 2 to get 2.5% (0.025), which corresponds to the shaded area on the normal distribution curve.
- 😀 The area of interest in the Z-table corresponds to 50% minus the alpha area (e.g., 50% - 2.5% = 47.5%).
- 😀 The value 0.475 is looked up in the Z-table to find the corresponding Z-value of 1.96.
- 😀 The critical Z-value for a 5% significance level is 1.96 for a two-tailed test.
- 😀 If the calculated Z-value (Z-hitung) is greater than 1.96, you reject the null hypothesis.
- 😀 If the calculated Z-value is less than 1.96 but still within the critical region, you fail to reject the null hypothesis.
- 😀 For an alpha level of 1%, the process is the same: divide alpha by 2 and look up the corresponding value in the Z-table.
Q & A
What is the purpose of the Z-test in statistics?
-The Z-test is used in statistics to determine whether there is a significant difference between the sample mean and the population mean. It is typically used when the sample size is large (greater than 20).
How does the Z-table relate to hypothesis testing?
-The Z-table helps determine the critical Z-value, which is used to define the rejection region in hypothesis testing. By comparing the calculated Z-value (Z hitung) to the critical Z-value, we can decide whether to reject the null hypothesis.
Why is the Z-table value dependent on the level of significance?
-The Z-table value depends on the level of significance (α) because the critical Z-value corresponds to the probability threshold, which is set by the chosen significance level. The Z-value is based on the cumulative probability from the normal distribution curve.
What does the α/2 represent in the Z-test?
-The α/2 represents the probability area in each tail of the normal distribution when using a two-tailed Z-test. For example, if the significance level is 5%, α/2 would be 2.5%, representing the area in each tail.
How do you find the Z-critical value for a given α level?
-To find the Z-critical value, you first divide the significance level α by 2 (for a two-tailed test). Then, find the corresponding cumulative probability value (e.g., 0.475 for α = 5%) in the Z-table, which gives the Z-critical value.
What is the significance of the value 1.96 in the Z-test?
-The value 1.96 is the Z-critical value for a significance level of 5% in a two-tailed test. This means that if the calculated Z-value (Z hitung) is greater than 1.96 or less than -1.96, we reject the null hypothesis.
How do you interpret the area under the curve in the Z-distribution graph?
-In the Z-distribution graph, the area under the curve represents the cumulative probability. For example, 50% of the area is to the left of the mean, and the area in each tail (for a two-tailed test) represents α/2, which is used to calculate the critical Z-value.
What happens if the calculated Z-value is greater than the critical Z-value?
-If the calculated Z-value is greater than the critical Z-value, it means the test statistic falls in the rejection region, and we reject the null hypothesis (H0).
How would the process change if the significance level α was 1% instead of 5%?
-If α was 1%, the process would be similar, but you would divide α by 2 to get 0.5% (α/2). You would then find the corresponding cumulative probability value (0.995) in the Z-table and use the Z-critical value associated with that probability.
What does the Z-table provide in relation to the standard normal distribution?
-The Z-table provides the cumulative probability for different Z-scores in the standard normal distribution. This helps identify the area under the curve to the left of a given Z-score, which is essential for finding the critical Z-value in hypothesis testing.
Outlines

This section is available to paid users only. Please upgrade to access this part.
Upgrade NowMindmap

This section is available to paid users only. Please upgrade to access this part.
Upgrade NowKeywords

This section is available to paid users only. Please upgrade to access this part.
Upgrade NowHighlights

This section is available to paid users only. Please upgrade to access this part.
Upgrade NowTranscripts

This section is available to paid users only. Please upgrade to access this part.
Upgrade NowBrowse More Related Video

Pemilihan statistik Z atau t
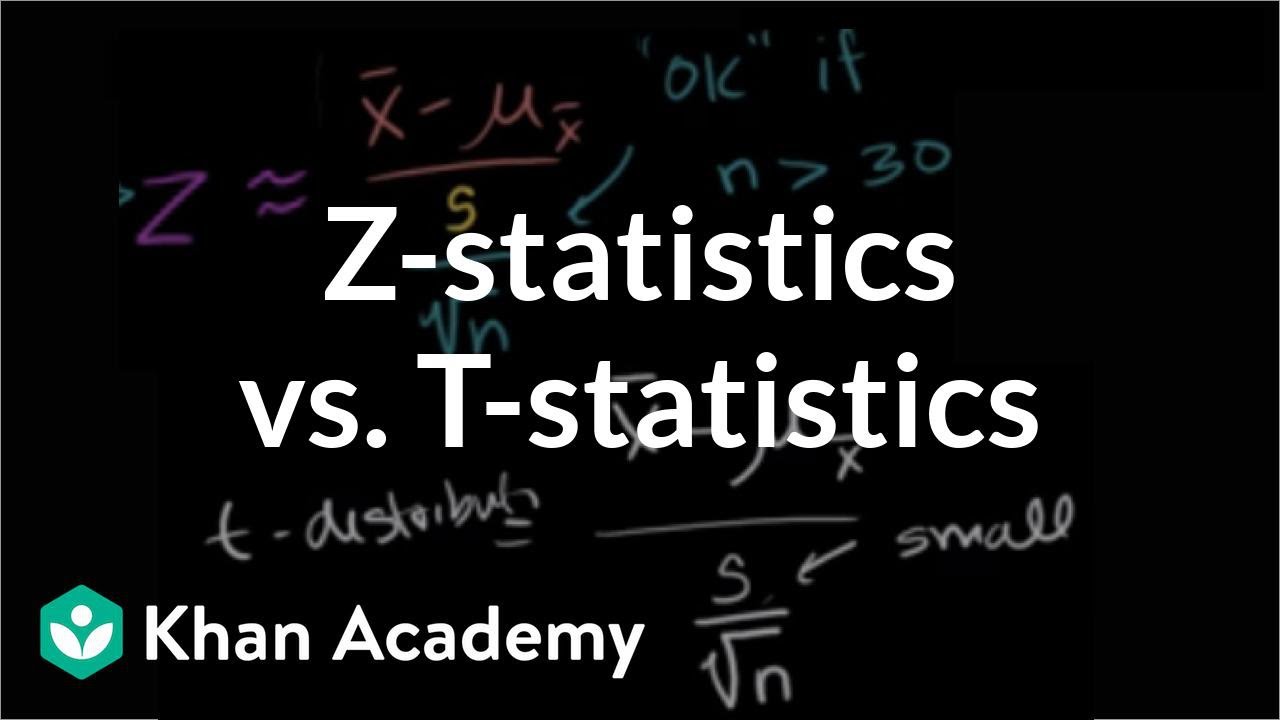
Z-statistics vs. T-statistics | Inferential statistics | Probability and Statistics | Khan Academy
Hypothesis Testing - Z test & T test

Jenis-jenis pengujian hipotesis: Uji Beda Rata-rata (Uji z dan Uji t)

Uji Hipotesis part 2 (Prosedur Pengujian Hipotesis, Statistik Uji, Wilayah Tolak/ Kritis)

pengujian hipotesis rata-rata dan proporsi suatu populasi
5.0 / 5 (0 votes)