ICT - Mastering High Probability Scalping Vol. 1 of 3
Summary
TLDRThis video script offers a comprehensive guide to mastering high probability scalping in Forex trading. The presenter emphasizes the importance of consistency and understanding market organization, introducing a simple yet effective scalping strategy based on targeting previous day's highs and lows. The tutorial covers identifying directional bias, optimal trade entries, and the significance of institutional trading patterns, all without the need for complex indicators.
Takeaways
- 📢 The video is part of a three-volume series on mastering high probability scalping in trading.
- 🔒 The presenter emphasizes the importance of original content and asks the community to report if their videos are re-uploaded without permission.
- 📈 High probability scalping is defined as achieving 10 to 30 pip price movements, focusing on short-term trading within a day.
- 📝 The presenter shares 20 years of trading experience, urging viewers to take notes and learn from the content provided.
- 🤔 The video aims to demonstrate that markets are not random but very organized, with specific intraday and weekly patterns.
- 📉 The presenter is known for trading within the weekly range, focusing on daily and weekly highs and lows.
- 🚫 The video discourages trying to trade every single day, emphasizing the importance of discipline and avoiding forced trades.
- 📊 The method taught involves using daily and hourly charts to identify directional bias and optimal trade entries for scalping.
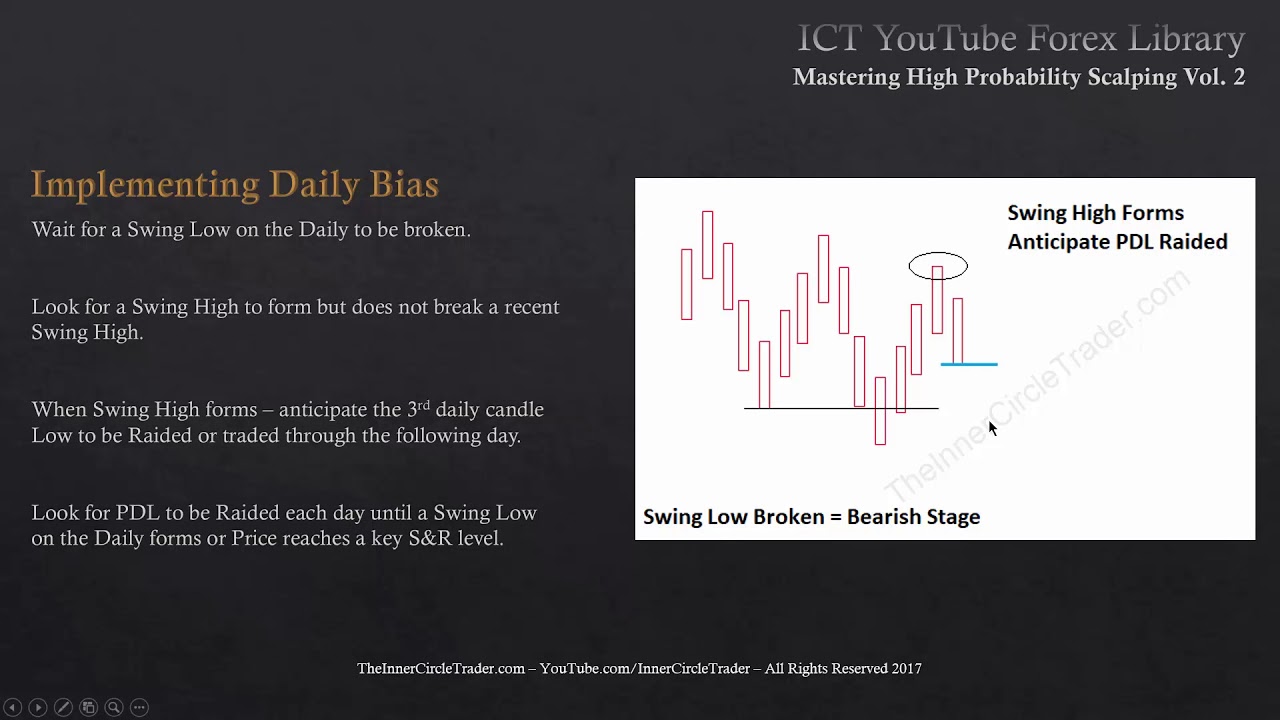
- 📌 Key to the strategy is identifying 'swing highs' and 'swing lows' on the daily chart to determine bullish or bearish market momentum.
- ⏰ The presenter highlights specific times of the day (London and New York sessions) as optimal for anticipating high probability trades.
Q & A
What is the main focus of the 'Mastering High Probability Scalping' video series?
-The video series focuses on teaching high probability scalping techniques in trading, specifically targeting 10 to 30 pip price movements within a day, using a method that emphasizes consistency and market organization.
Why does the presenter ask the trading community to report if their content is re-uploaded on other YouTube channels?
-The presenter requests this because they want to protect their intellectual property and receive credit and revenue from their work, which they have put effort into creating.
What is the definition of 'high probability scalps' according to the presenter?
-For the presenter, high probability scalps are defined as trades that aim for 10 to 30 pip price movements, which are executed within a single trading day.
What is the presenter's specialty in trading?
-The presenter's specialty is trading the weekly range, focusing on daily and weekly highs and lows, which they refer to as their 'one shot one kill' approach.
What is the importance of the 'draw' in the context of the presenter's trading strategy?
-The 'draw' refers to the price levels that the market is likely to reach for, specifically targeting previous day's highs or lows, which are areas of liquidity or buy/sell orders that can drive the market price.
How does the presenter define a 'bullish' market in terms of price action?
-A 'bullish' market is defined by the presenter as one where the price action shows a swing high with two lower highs on either side, and the price breaks through this swing high, indicating an upward momentum.
What is the significance of 'swing highs' and 'swing lows' in the presenter's trading methodology?
-Swing highs and swing lows are significant as they indicate potential reversal points in the market. They are used to identify the market's directional bias and to anticipate future price movements.
Why does the presenter emphasize the importance of trading during specific time frames?
-The presenter emphasizes specific time frames because they believe these are the periods when the market is most active and likely to present high probability trading opportunities, particularly during the overlap of London and New York trading sessions.
What is the purpose of practicing on a demo account as mentioned by the presenter?
-Practicing on a demo account allows traders to apply and refine the strategies taught without risking real money, helping them to understand price action better and to develop consistency in their trading approach.
How does the presenter define an 'optimal trade entry' in the context of scalping?
-An 'optimal trade entry' is defined as an entry point that occurs after a price retracement to a logical level, such as a Fibonacci level (62% or 70%), and is targeting a previous day's high or low, which are areas of expected liquidity.
What is the advice given by the presenter regarding trading multiple currency pairs?
-The presenter advises against trading multiple currency pairs at once, especially for beginners. Instead, they recommend focusing on one major currency pair with the dollar to simplify the learning process and improve understanding of price action.
Outlines

This section is available to paid users only. Please upgrade to access this part.
Upgrade NowMindmap

This section is available to paid users only. Please upgrade to access this part.
Upgrade NowKeywords

This section is available to paid users only. Please upgrade to access this part.
Upgrade NowHighlights

This section is available to paid users only. Please upgrade to access this part.
Upgrade NowTranscripts

This section is available to paid users only. Please upgrade to access this part.
Upgrade NowBrowse More Related Video

FXで1日1万円稼ぐ技術、スキャルピング完全解説

Hệ Thống Scalping Trên Chart 5 Phút Của Kathy Lien - Nhật Hoài Trader

ICT Forex - Higher Time Frame Concepts

ICT Forex - The ICT New York Killzone

Forex Trading for Beginners in India | What is Forex Trading | Best Forex Trading Strategy in India
ICT - Mastering High Probability Scalping Vol. 2 of 3
5.0 / 5 (0 votes)