Understanding Relations I Señor Pablo TV
Summary
TLDRThis educational video script introduces the concept of relations in mathematics, focusing on the representation of ordered pairs. It outlines four distinct methods to depict relations: table of values, mapping or arrow diagram, graph, and rule. The script explains each method with examples, starting with the table of values, where x and y coordinates are listed, followed by the mapping diagram that uses arrows to show the relationship between domains and ranges. The graph method plots these points in a coordinate system, and the rule method identifies a pattern, such as the sum of coordinates being constant. The script is designed to help viewers understand and visualize mathematical relations effectively.
Takeaways
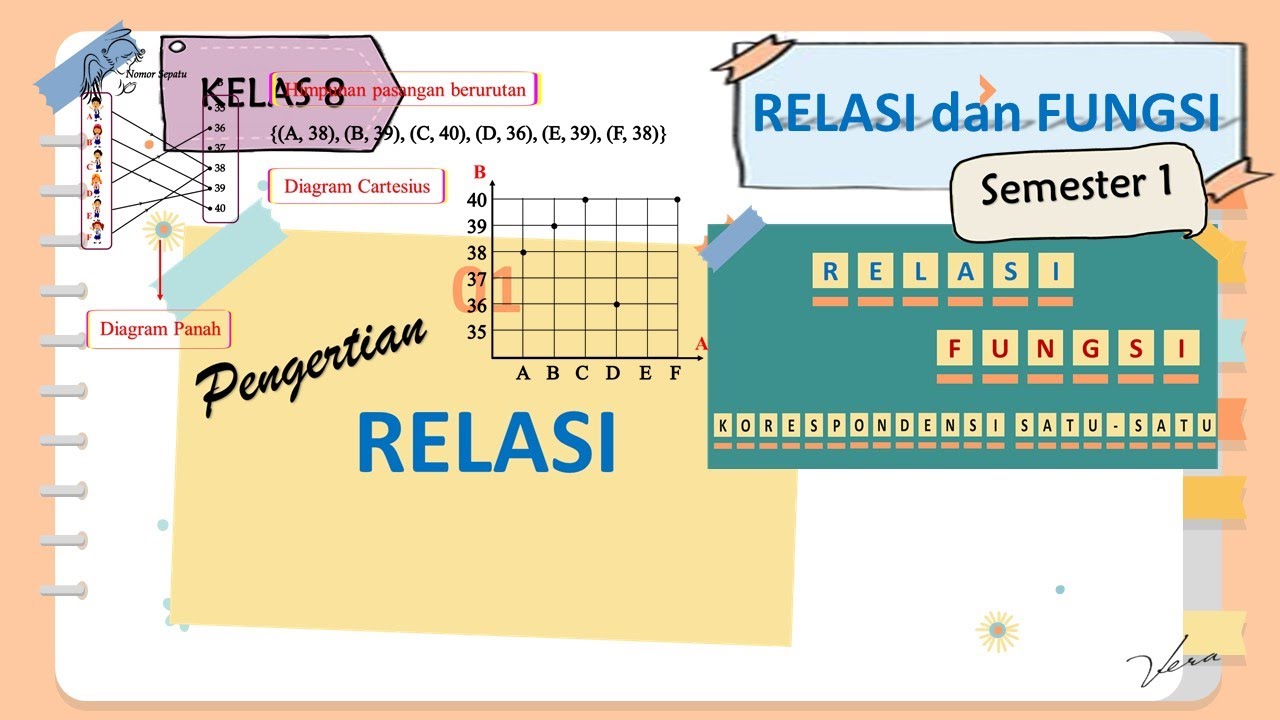
- 📚 A relation is defined as a set of ordered pairs, with each pair consisting of an x-coordinate (abscissa) and a y-coordinate (ordinate).
- 📊 There are four primary ways to represent relations: table of values, mapping or arrow diagram, graph, and rule.
- 📈 The table of values is a tabular representation where the x-coordinates (abscissa) are listed horizontally and the y-coordinates (ordinate) are listed vertically.
- 🔍 The mapping or arrow diagram visually shows the relationship between x and y coordinates using arrows to connect corresponding values.
- 📊 The graph representation plots the ordered pairs on a coordinate system, allowing for a visual understanding of the relation as a whole.
- ✏️ The rule representation is a mathematical formula or condition that defines the relationship between the x and y coordinates, such as a sum or product.
- 🔢 For the given example, the rule is that the sum of the x-coordinate and y-coordinate equals six, illustrating a specific type of linear relation.
- 📐 The graph of the relation is a visual tool that can help identify patterns or characteristics of the relation, such as whether it is a linear function.
- 📝 Understanding different representations of relations is crucial for various mathematical applications, including functions and data analysis.
- 🎓 The video serves as an educational resource, teaching viewers how to interpret and work with relations in multiple formats.
Q & A
What is a relation in mathematics?
-A relation in mathematics is a set of ordered pairs, where each pair consists of an x-coordinate (abscissa) and a y-coordinate (ordinate).
How many ways can a relation be represented?
-A relation can be represented in four different ways: as a table of values, a mapping or arrow diagram, a graph, and by a rule.
What is the term for the first number in an ordered pair?
-The first number in an ordered pair is called the abscissa or x-coordinate.
What is the term for the second number in an ordered pair?
-The second number in an ordered pair is called the ordinate or y-coordinate.
How is a table of values created for a relation?
-A table of values is created by listing the x-coordinates (abscissa) in one column and the corresponding y-coordinates (ordinate) in another column.
What is a mapping or arrow diagram?
-A mapping or arrow diagram is a visual representation of a relation where each x-coordinate is connected to its corresponding y-coordinate with an arrow.
What is the term for the left side of a mapping diagram?
-The left side of a mapping diagram is known as the domain, which represents the set of x-coordinates.
What is the term for the right side of a mapping diagram?
-The right side of a mapping diagram is known as the range, which represents the set of y-coordinates.
How are points plotted on a graph to represent a relation?
-Points are plotted on a graph by marking the x-coordinate on the horizontal axis and the corresponding y-coordinate on the vertical axis.
What is a rule in the context of representing a relation?
-A rule is a mathematical statement or condition that defines the relationship between the x-coordinate and y-coordinate in a set of ordered pairs.
Can you provide an example of a rule from the script?
-Yes, an example of a rule from the script is that if you add the x-coordinate (abscissa) and y-coordinate (ordinate), the sum equals six.
Outlines

This section is available to paid users only. Please upgrade to access this part.
Upgrade NowMindmap

This section is available to paid users only. Please upgrade to access this part.
Upgrade NowKeywords

This section is available to paid users only. Please upgrade to access this part.
Upgrade NowHighlights

This section is available to paid users only. Please upgrade to access this part.
Upgrade NowTranscripts

This section is available to paid users only. Please upgrade to access this part.
Upgrade NowBrowse More Related Video

Relasi dan Fungsi | Matematika SMP
1 PENGERTIAN RELASI - RELASI DAN FUNGSI - KELAS 8 SMP

LOMBA VIDEO INOVASI PEMBELAJARAN / BEST PRACTICE / INOBEL / VIDEO PRAKTIK BAIK
THE LANGUAGE OF RELATIONS AND FUNCTIONS || MATHEMATICS IN THE MODERN WORLD
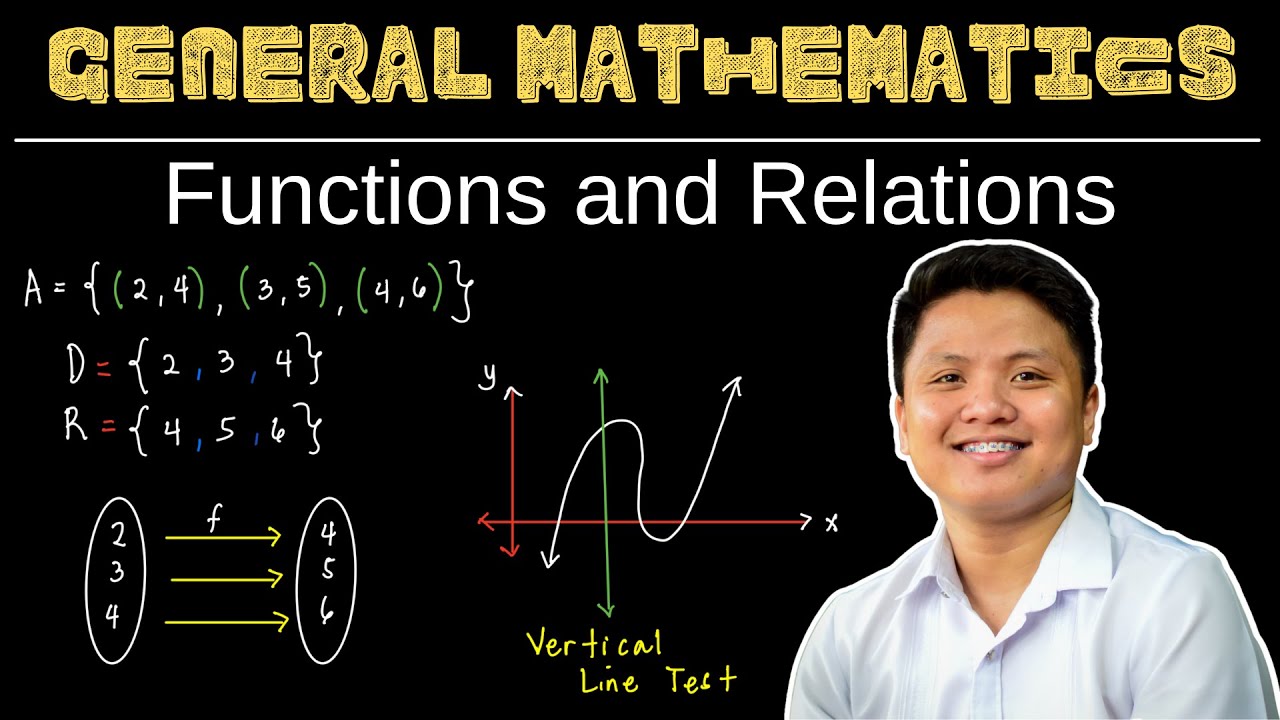
Relations and Functions | General Mathematics | Grade 11

RÁPIDO e FÁCIL | PLANO CARTESIANO | PRODUTO CARTESIANO
5.0 / 5 (0 votes)