REPRESENTATION OF FUNCTIONS ┃Grade 11 General Mathematics
Summary
TLDRIn this video, different ways of representing functions and relations are explored, including mapping diagrams, tables of values, and graphs. The video explains how mapping diagrams can show if a relation is a function, highlighting key points like how each domain element should correspond to only one range element. It also discusses how a table of values can confirm whether a relation is a function by ensuring no x-value maps to multiple y-values. Lastly, the vertical line test is introduced to determine if a graph represents a function, with practical examples to illustrate the concepts.
Takeaways
- 😀 Functions can be represented in different ways, including ordered pairs, mapping diagrams, tables of values, and graphs.
- 😀 In a mapping diagram, arrows represent the relationship between x values (domain) and y values (range).
- 😀 A mapping diagram represents a function if each element in the domain is paired with only one value in the range.
- 😀 If an x value is paired with more than one y value in a mapping diagram, it is not a function but a relation.
- 😀 A table of values has two rows: one for the x values (domain) and the other for the y values (range).
- 😀 A table of values represents a function if each x value corresponds to only one y value.
- 😀 In a graph, the vertical line test is used to determine if a relation is a function.
- 😀 A graph represents a function if any vertical line drawn intersects the graph at most once.
- 😀 If a vertical line intersects a graph more than once, the relation is not a function.
- 😀 The vertical line test helps easily distinguish between a function and a relation when using graphs.
- 😀 If a mapping diagram or table shows that each x value is paired with one and only one y value, it is confirmed as a function.
Q & A
What are the common ways to represent a function or relation?
-Functions and relations can be represented using sets of ordered pairs, mapping diagrams, tables of values, and graphs.
What is a mapping diagram and how is it used to represent functions?
-A mapping diagram uses arrows to show the relationship between the x values (domain) and y values (range). It helps to visually display how each element in the domain is paired with an element in the range.
How do you know if a mapping diagram represents a function?
-A mapping diagram represents a function if each element of the domain is paired with exactly one value in the range. There cannot be any x value that corresponds to more than one y value.
In the example provided, why is the first mapping diagram a function?
-The first mapping diagram is a function because each x value (negative 2, 2, 4, 5, 6) is paired with exactly one y value, even though some x values share the same y value.
Why is the second mapping diagram not a function?
-The second mapping diagram is not a function because the x values negative 1 and 1 are each paired with more than one y value (negative 1 is paired with 3 and 4, and 1 is paired with 1 and 2).
What is a table of values, and how does it represent functions?
-A table of values is a two-row table where the first row contains the x values (domain) and the second row contains the y values (range). It represents a function if each x value is paired with only one y value.
How can a table of values be used to identify a function?
-A table of values identifies a function if no x value is paired with more than one y value. In the given example, the x values 1, 2, 3, and 4 are paired with y values 2, 4, 6, and 8 respectively, confirming it as a function.
What is the vertical line test, and how is it used to determine if a graph represents a function?
-The vertical line test is a method used to determine if a graph represents a function. A graph represents a function if and only if any vertical line drawn on the graph intersects it at most once.
Why does the first graph pass the vertical line test?
-The first graph passes the vertical line test because each vertical line intersects the graph at most once, which indicates it is a function.
Why does the second graph fail the vertical line test?
-The second graph fails the vertical line test because some vertical lines intersect the graph more than once, which means it is not a function.
Outlines

Этот раздел доступен только подписчикам платных тарифов. Пожалуйста, перейдите на платный тариф для доступа.
Перейти на платный тарифMindmap

Этот раздел доступен только подписчикам платных тарифов. Пожалуйста, перейдите на платный тариф для доступа.
Перейти на платный тарифKeywords

Этот раздел доступен только подписчикам платных тарифов. Пожалуйста, перейдите на платный тариф для доступа.
Перейти на платный тарифHighlights

Этот раздел доступен только подписчикам платных тарифов. Пожалуйста, перейдите на платный тариф для доступа.
Перейти на платный тарифTranscripts

Этот раздел доступен только подписчикам платных тарифов. Пожалуйста, перейдите на платный тариф для доступа.
Перейти на платный тарифПосмотреть больше похожих видео
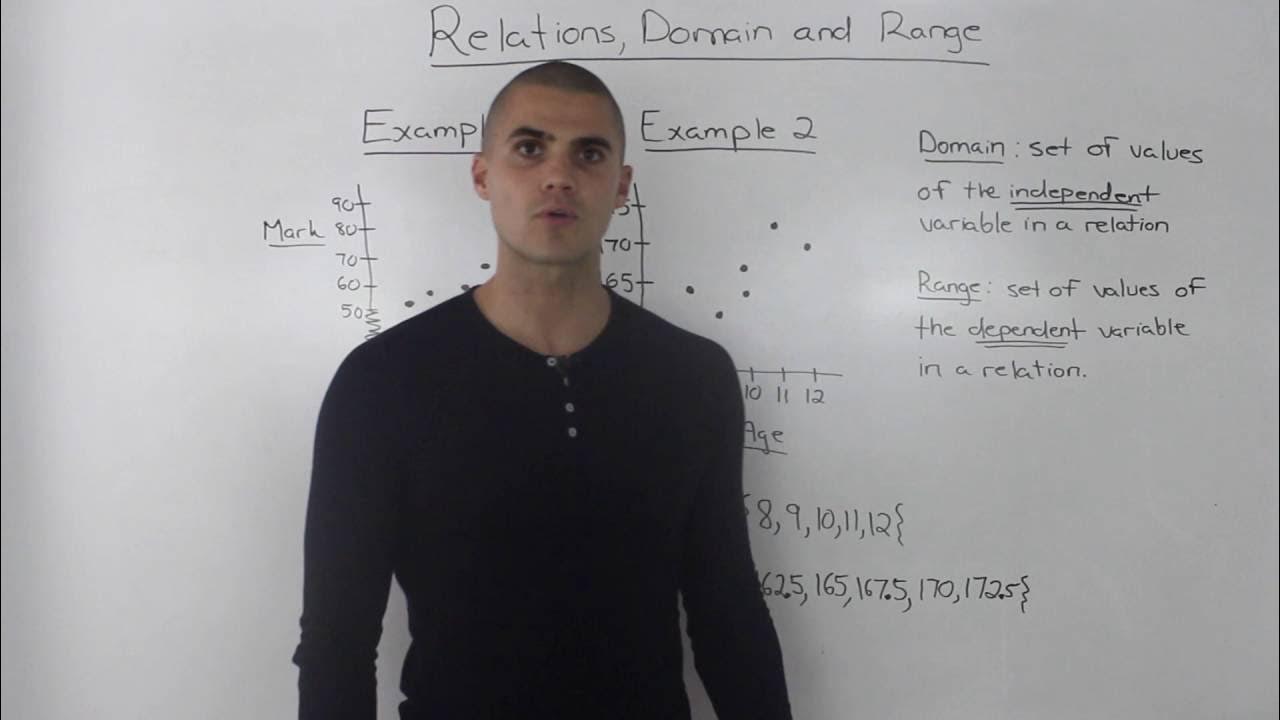
MCR3U (1.1) - Functions - relations, domain and range

FUNCTIONS | SHS GRADE 11 GENERAL MATHEMATICS QUARTER 1 MODULE 1 LESSON 1

FUNCTIONS AND RELATIONS AND EVALUATION OF FUNCTIONS
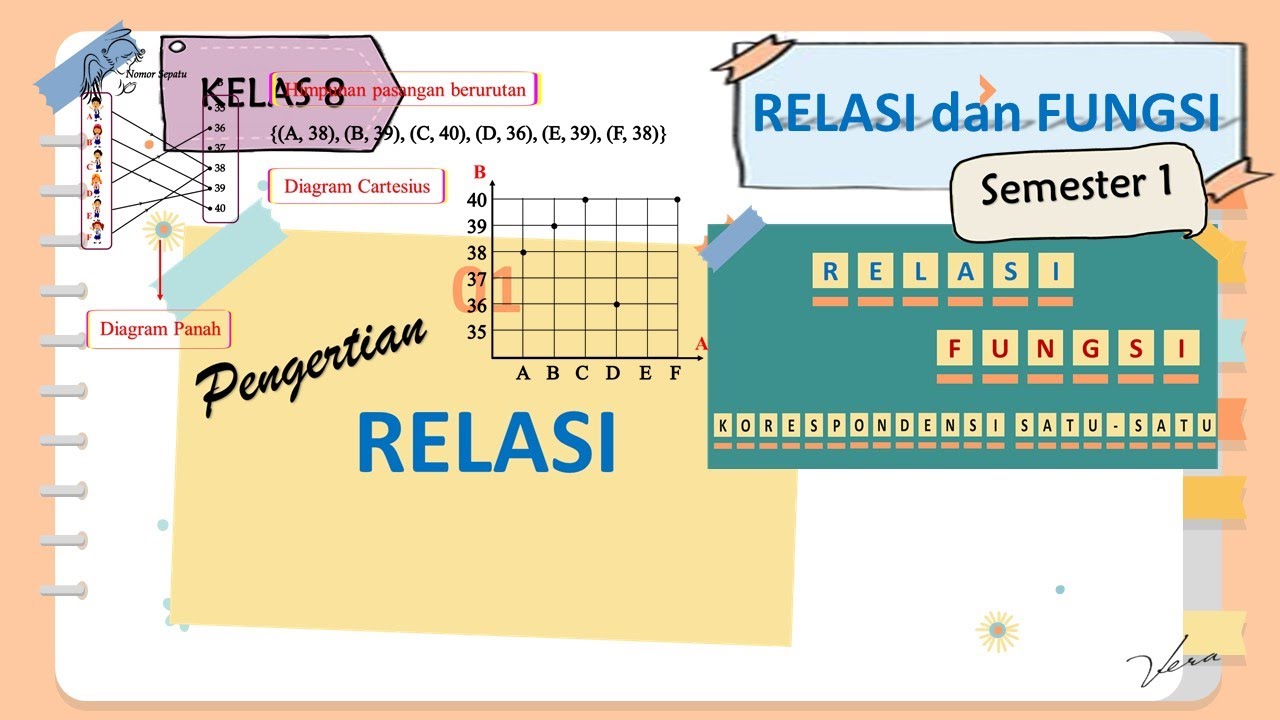
1 PENGERTIAN RELASI - RELASI DAN FUNGSI - KELAS 8 SMP

Relations & Functions
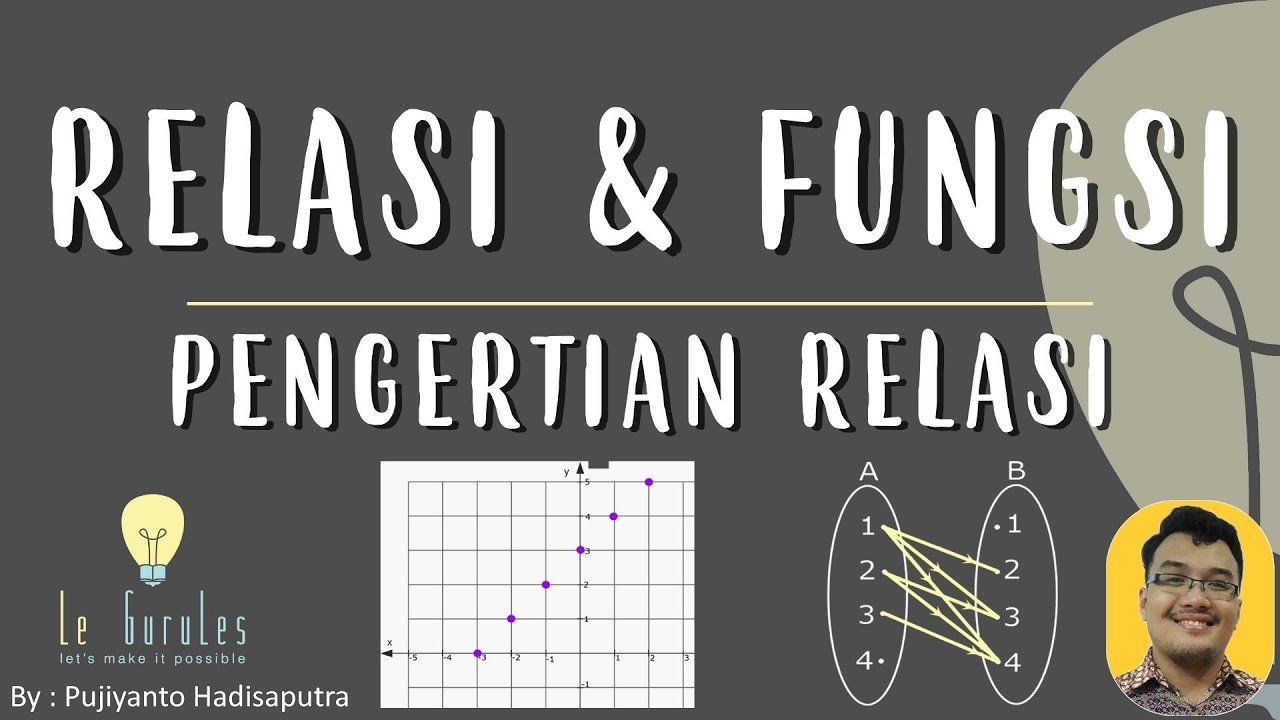
Relasi & Fungsi (1) - Relasi, Pengertian Relasi, Contoh Relasi - Matematika SMP
5.0 / 5 (0 votes)
