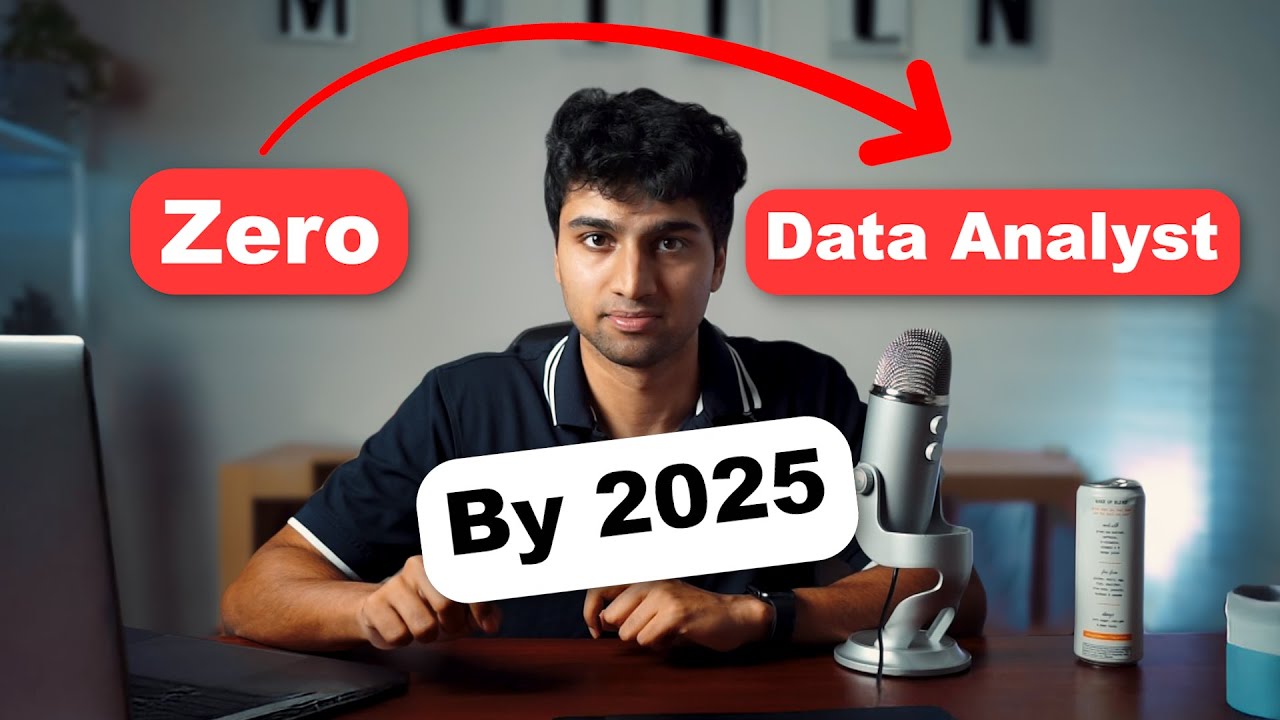
How I would learn Data Analysis (If i could start over) | Data Analyst Roadmap 2024
Summary
TLDRThis video serves as a comprehensive roadmap for aspiring data analysts, highlighting essential skills and resources for success in the field. It covers the key roles of a data analyst, from data collection and cleaning to exploratory analysis and visualization. Emphasizing the importance of technical skills like statistics, SQL, and Python, the presenter also stresses the value of effective communication and unique projects that reflect personal interests. With practical tips on choosing datasets and building a standout portfolio, this guide aims to equip freshers with the knowledge and tools to thrive in data analysis careers.
Takeaways
- 😀 The data analyst role is a primary choice for freshers in Canada, with an average salary ranging from $70,000 to $90,000 for those with less than two years of experience.
- 🛠️ A data analyst's job involves helping organizations make data-driven decisions by interpreting data stories, which requires following four key steps: data collection, data cleaning and preprocessing, exploratory data analysis, and data visualization and communication.
- 🔍 Data collection can involve various sources, including SQL databases and FTP servers, and analysts must possess the skills to gather data effectively.
- 🧹 Data cleaning and preprocessing are essential to ensure the data is in a usable format, free from null values and duplicates.
- 📈 Exploratory data analysis (EDA) is critical for identifying trends and patterns within the data to solve specific problems.
- 📊 Visualization and communication skills are crucial for a data analyst to present data insights clearly to stakeholders using charts and graphs.
- 📚 Technical skills needed to become a data analyst include a solid understanding of statistics and basic mathematics, which are fundamental for analyzing data trends.
- 💻 Key technical tools for data analysts include Excel, SQL, Python, and data visualization tools like Tableau and Power BI.
- 🌐 To stand out as a fresher, focus on personal projects using interesting datasets that reflect your passion, rather than generic datasets commonly used by others.
- 🚀 Utilizing web scraping techniques can enhance your data analysis skills beyond visualization by allowing you to practice data cleaning and preprocessing.
Q & A
What is the primary purpose of the video?
-The primary purpose of the video is to provide a comprehensive overview of the key concepts and practices related to safe driving and traffic regulations.
What are the main topics covered in the video?
-The video covers topics such as road signs, safe driving techniques, the importance of wearing seatbelts, and the consequences of distracted driving.
Why is it important to understand road signs?
-Understanding road signs is crucial as they provide essential information that helps drivers navigate safely and obey traffic laws.
What are some safe driving techniques mentioned in the video?
-Some safe driving techniques include maintaining a safe following distance, using turn signals, and checking blind spots before changing lanes.
How does the video address the issue of distracted driving?
-The video highlights the dangers of distracted driving, emphasizing that activities like texting or using a phone while driving can lead to accidents and severe consequences.
What role do seatbelts play in ensuring driver safety?
-Seatbelts are critical for driver safety as they significantly reduce the risk of injury or death in the event of a collision by keeping occupants securely in their seats.
What consequences of traffic violations does the video discuss?
-The video discusses various consequences of traffic violations, including fines, points on the driver's license, and the potential for increased insurance premiums.
How does the video encourage viewers to be responsible drivers?
-The video encourages viewers to be responsible drivers by promoting awareness of road safety practices, adherence to traffic laws, and the importance of remaining focused while driving.
What statistics does the video provide regarding traffic accidents?
-The video provides statistics indicating that a significant percentage of traffic accidents are caused by human error, particularly distracted driving and speeding.
What final message does the video convey to viewers?
-The final message of the video is to prioritize safety on the road by being informed, responsible, and attentive drivers, thus contributing to a safer driving environment for everyone.
Outlines

Этот раздел доступен только подписчикам платных тарифов. Пожалуйста, перейдите на платный тариф для доступа.
Перейти на платный тарифMindmap

Этот раздел доступен только подписчикам платных тарифов. Пожалуйста, перейдите на платный тариф для доступа.
Перейти на платный тарифKeywords

Этот раздел доступен только подписчикам платных тарифов. Пожалуйста, перейдите на платный тариф для доступа.
Перейти на платный тарифHighlights

Этот раздел доступен только подписчикам платных тарифов. Пожалуйста, перейдите на платный тариф для доступа.
Перейти на платный тарифTranscripts

Этот раздел доступен только подписчикам платных тарифов. Пожалуйста, перейдите на платный тариф для доступа.
Перейти на платный тарифПосмотреть больше похожих видео

8 In-Demand Data Analytics Skills to Get You Hired

Data Analyst Roadmap with Free Resources !!

How to become a Data Analyst FAST (By 2025)

How to learn SQL for free | Roadmap to learning SQL

Perfect Roadmap To Become AI Engineers In 2024 With Free Videos And Materials

Bagaimana Cara Menjadi Data Analis | Data Analyst Roadmap
5.0 / 5 (0 votes)
