Statistics 101: Linear Regression, The Very Basics 📈

Brandon Foltz
23 Nov 201322:55

Summary

TLDRIn this instructional video, Brandon introduces the concept of simple linear regression, emphasizing its foundational role in statistics. He motivates viewers with encouragement and offers to connect on social media. The video explains that without an independent variable, the best prediction for a dependent variable is its mean. Brandon uses a restaurant tipping scenario to illustrate this, showing how to predict tip amounts based on their average. He also introduces the idea of residuals and the sum of squared residuals (SSE), which is key for assessing the fit of a regression model. The video sets the stage for upcoming discussions on more complex regression analyses.

Takeaways

  • 😀 Stay positive and believe in your ability to overcome challenges in learning statistics.
  • 📢 Follow the presenter on social media platforms to stay updated with new video releases.
  • 👍 Engage with the content by liking, sharing, and providing constructive feedback to help improve future videos.
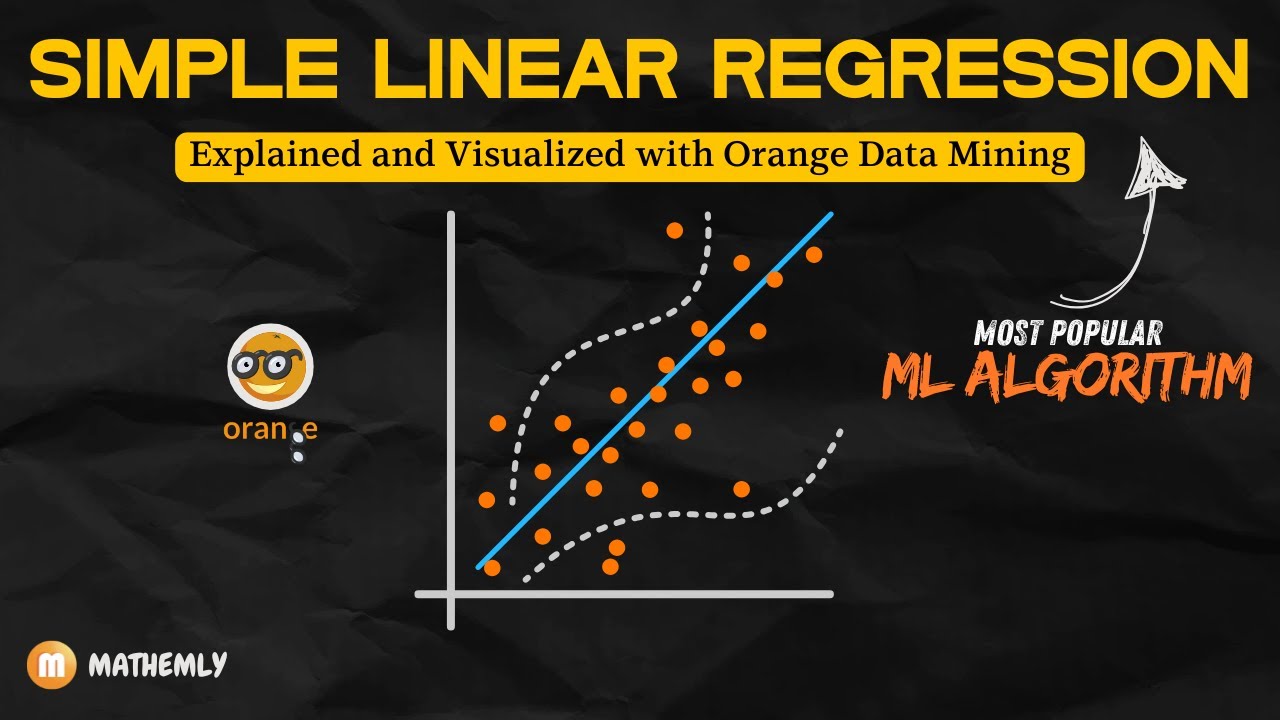
  • 📊 Simple linear regression involves modeling the relationship between two variables: an independent variable and a dependent variable.
  • 📈 The 'goodness' of a regression model is determined by how well it compares to a model that assumes no relationship between variables.
  • 🔢 In the absence of an independent variable, the mean of the dependent variable is used as the best predictor.
  • 📋 The term 'regression' specifically refers to simple linear regression unless mentioned otherwise.
  • 📉 Residuals, or the differences between observed values and the mean prediction, are a key concept in understanding regression.
  • 🔴 The sum of squared residuals (SSE) is a measure used to evaluate how well the regression line fits the data.
  • 📉 The goal of simple linear regression is to find a line that minimizes the SSE, indicating a better fit to the data.
  • 📖 The upcoming videos will delve deeper into the concepts and calculations involved in simple linear regression.

Q & A

  • What is the main theme of the video series?

    -The main theme of the video series is basic statistics, with a focus on simple linear regression in this particular video.

  • What is the first piece of advice given by Brandon to viewers who are struggling in their class?

    -The first piece of advice is to stay positive and keep their head up, acknowledging that they have already accomplished a lot and that hard work, practice, and patience will help them through their struggles.

  • How does Brandon encourage viewers to stay connected with his content?

    -Brandon encourages viewers to follow him on various social media platforms like YouTube, Twitter, Google Plus, and LinkedIn to be notified when new videos are uploaded.

  • What is the significance of liking and sharing the video as mentioned in the script?

    -Liking and sharing the video is a way to encourage Brandon to continue making educational content, and it helps to spread the knowledge to classmates, colleagues, or through playlists.

  • What is the purpose of the 'tips for service' example used in the video?

    -The 'tips for service' example is used to illustrate how regression can be used to predict the amount of tip one might expect based on the total bill amount at a restaurant.

  • What is the dependent variable in the 'tips for service' example?

    -In the 'tips for service' example, the dependent variable is the tip amount.

  • Why does Brandon emphasize the importance of understanding the underlying meaning behind good regression models?

    -Brandon emphasizes understanding the underlying meaning behind good regression models to ensure viewers not only know what is happening but also why and how to apply it.

  • What does Brandon mean when he says 'regression allows us to model mathematically the relationship between two or more variables'?

    -This means that regression analysis helps in establishing a mathematical model that describes how one variable (dependent) is related to one or more other variables (independent).

  • What is the best prediction for the next tip amount if only the tip data is available?

    -If only the tip data is available, the best prediction for the next tip amount is the mean of the existing tip amounts.

  • What is a residual in the context of this video?

    -A residual is the difference between the observed value (actual tip amount) and the predicted value (mean of tips or value on the best fit line).

  • Why are residuals squared in the calculation of the sum of squared residuals?

    -Residuals are squared to ensure all values are positive and to emphasize larger deviations from the mean, which helps in calculating the sum of squared residuals (SSE).

  • What is the goal of simple linear regression as described in the video?

    -The goal of simple linear regression is to create a linear model that minimizes the sum of squares of the residuals, which is another way of saying it minimizes the sum of squares of the error.

Outlines

00:00

📚 Introduction to Basic Statistics

Brandon begins the video by encouraging viewers struggling in a class to stay positive and reminding them of their accomplishments. He emphasizes the importance of hard work, practice, and patience. Brandon invites viewers to follow him on various social media platforms to stay updated with new content and stresses the value of connecting with his audience. He also encourages viewers to like, share, and give feedback on the video to help improve future content. The video aims to cover basic statistics concepts, specifically simple linear regression, in a slow and deliberate manner to ensure understanding.

05:00

📈 One-Variable Prediction Model

In this section, Brandon discusses how to predict the tip amount for future meals using only the data collected on tip amounts. He explains that with only one variable, the best prediction for any given tip amount is the mean of the sample, which in this case is $10. He demonstrates how to create a graph with meal numbers on the x-axis and tip amounts on the y-axis, and then plots the data points. Brandon emphasizes that the mean is the best predictor in the absence of additional variables and introduces the concept of residuals, which are the differences between observed values and the mean.

10:02

🔍 Understanding Residuals and Error

Brandon elaborates on the concept of residuals, which are the distances of the observed data points from the mean (best fit line). He explains that residuals are also known as errors and always sum up to zero. To quantify the deviation of each data point from the mean, he introduces the idea of squaring the residuals, which serves to make all values positive and emphasize larger deviations. The sum of these squared residuals is referred to as the Sum of Squared Residuals (SSR) or Sum of Squared Errors (SSE), which is a key metric in assessing the fit of a model to the data.

15:03

📉 Minimizing Sum of Squared Residuals

Here, Brandon reveals the core objective of simple linear regression, which is to create a linear model that minimizes the sum of squared residuals. He explains that by introducing an independent variable, the model can account for some of the error, thus reducing the SSE. The video uses a hypothetical scenario where the independent variable (bill amount) is ignored, and the model's effectiveness is judged by how much it can reduce the SSE compared to a model that only uses the mean of the dependent variable (tip amount).

20:05

🔄 Recap and Anticipation for Future Content

In the final paragraph, Brandon reviews the key points of the video, emphasizing that simple linear regression is a comparison between a model with an independent variable and one without. He reiterates that the best prediction for future values, when only the mean of the dependent variable is known, is that mean itself. Brandon also previews that future videos will delve deeper into the role of the independent variable in explaining the dependent variable and how it affects the residuals and the SSE.

Mindmap

Keywords

💡Statistics

Statistics is a branch of mathematics dealing with the collection, analysis, interpretation, presentation, and organization of data. In the video, statistics is the central theme, as the presenter discusses basic statistical concepts and their application in real-world scenarios such as predicting tip amounts in a restaurant.

💡Regression

Regression refers to a set of statistical methods used to understand the relationship between a dependent variable and one or more independent variables. The video focuses on simple linear regression, which is a basic form of regression analysis that uses a straight line to describe the relationship between two variables.

💡Dependent Variable

A dependent variable is the variable that is being predicted or explained by other variables in a regression analysis. In the context of the video, the tip amount is the dependent variable, which the presenter aims to predict based on other factors.

💡Independent Variable

An independent variable is a variable that is believed to influence the dependent variable. In the video, the presenter mentions that in a typical scenario, the total bill amount would be an independent variable that influences the tip amount.

💡Residual

Residuals are the differences between the actual observed values and the values predicted by a regression model. The video explains that residuals are calculated by subtracting the predicted tip amount (mean) from the actual tip amount and are crucial for evaluating the fit of the model.

💡Mean

The mean, often referred to as the average, is calculated by adding all values in a data set and then dividing by the number of values. In the video, the presenter uses the mean of the tip amounts as a baseline prediction when no other variables are considered.

💡Sum of Squared Residuals (SSR)

SSR is a measure used in regression analysis to quantify the discrepancy between the data and an estimation model. The video script explains that SSR is the sum of the squares of residuals and is used to evaluate how well the regression model fits the data.

💡Best Fit Line

The best fit line is the line that minimizes the sum of squared residuals between the observed values and the values predicted by the model. The video discusses how the goal of regression is to find this line that best fits the data.

💡Linear Model

A linear model is a statistical model in which the relationship between the dependent variable and independent variables is assumed to be linear. The video is part of a series on simple linear regression, which uses a linear model to predict outcomes.

💡Standard Deviation

Standard deviation is a measure of the amount of variation or dispersion in a set of values. Although not directly mentioned in the script, the concept is related to residuals and their squaring, which is a step in calculating standard deviation.

💡Constructive Comment

A constructive comment is a suggestion or critique that is intended to improve or provide useful feedback. The video script encourages viewers to leave constructive comments if they think there's something the presenter could do better.

Highlights

Encouragement for viewers struggling with statistics classes to stay positive and persevere.

Invitation to follow the presenter on various social media platforms for updates.

Request for viewers to give feedback through likes and constructive comments.

Introduction to the concept of simple linear regression as a basic statistical method.

Explanation of regression as a way to model relationships between variables using algebra.

Clarification that 'regression' in this context refers to simple linear regression.

Discussion on the importance of understanding the 'goodness' of a regression model.

Introduction of basic regression terminology and concepts.

Explanation of the absence of formulas or calculations in this introductory video.

Description of a real-world scenario involving predicting tip amounts in a restaurant.

Challenge to predict future tip amounts using only the data collected.

Introduction to the concept of visualizing data through graphs and charts.

Explanation of how to graph data points with meal numbers and tip amounts.

Discussion on using the mean as the best predictor when only one variable is available.

Introduction to the concept of residuals and their calculation.

Explanation of why residuals are squared in statistical analysis.

Introduction to the sum of squared residuals (SSE) and its significance.

Revealing the goal of simple linear regression: to minimize the sum of squares of the residuals.

Discussion on how introducing an independent variable can reduce the SSE.

Conclusion that simple linear regression is a comparison of two models: one with and one without an independent variable.

Final thoughts on the importance of understanding the comparison between models in regression analysis.

Transcripts

play00:00

(gentle acoustic guitar music)

play00:17

- [Brandon] Hello, thanks for watching,

play00:19

and welcome to the next video in my series

play00:21

on basic statistics.

play00:23

Now as usual, a few things before we get started.

play00:26

Number one, if you're watching this video

play00:28

because you are struggling in a class right now,

play00:31

I want you to stay positive and keep your head up.

play00:34

If you're watching this, it means you've accomplished

play00:36

quite a bit already.

play00:37

You're very smart and talented,

play00:39

but you may have just hit a temporary rough patch.

play00:42

Now I know with the right amount of hard work, practice,

play00:45

and patience, you can work through it.

play00:48

I have faith in you,

play00:50

many other people around you have faith in you,

play00:53

so so should you.

play00:55

Number two, please feel free to follow me here on YouTube,

play00:57

on Twitter, on Google Plus, or on LinkedIn.

play01:02

That way when I upload a new video, you know about it.

play01:05

And it's always nice to connect with my viewers online.

play01:09

I feel that life is much too short

play01:10

and the world is much too large

play01:12

for us to miss the chance to connect when we can.

play01:16

Number three, if you like the video,

play01:17

please give it a thumbs up.

play01:19

Share it with classmates or colleagues,

play01:22

or put it on a playlist.

play01:23

That does encourage me to keep making them for you.

play01:26

On the flip side,

play01:27

if you think there's something I can do better,

play01:29

please leave a constructive comment below the video,

play01:32

and I will take those ideas into account

play01:34

when I make new ones.

play01:36

And finally, just keep in mind that these videos are meant

play01:39

for individuals who are relatively new to stats.

play01:42

So I'm just going over basic concepts.

play01:45

And I will be doing so in a slow, deliberate manner.

play01:49

Not only do I want you to know what is going on,

play01:53

but also why, and how to apply it.

play01:56

So all that being said, let's go ahead and get started.

play02:02

Okay, so this is the first video in what will be,

play02:05

or is, depending on when you're watching this,

play02:07

a multi-part video series about simple linear regression.

play02:12

In the next few minutes, we will cover the basics

play02:14

of simple linear regression starting at square one.

play02:18

And for the record, from now on if I say just regression,

play02:22

I am referring to simple linear regression

play02:25

as opposed to multiple regression

play02:27

or models that are not linear,

play02:29

which we will hopefully get to those at a later date.

play02:33

Now regression allows us to model

play02:35

mathematically the relationship between

play02:38

two or more variables, using very simple algebra,

play02:42

to be specific.

play02:44

For now, we'll be working with just two variables;

play02:47

An independent variable, and a dependent variable.

play02:51

The truth is, when we talk about how quote "good"

play02:55

a regression model is, we are actually comparing it

play02:59

to another specific model.

play03:02

Oftentimes, students don't realize this.

play03:06

So in this video, we're gonna talk about that idea.

play03:10

I will also begin introducing basic terminology and concepts

play03:14

that will carry you through your work using regression.

play03:18

There are no formulas or calculations in this video.

play03:22

We're just introducing the underlying meaning

play03:24

behind good regression models.

play03:28

So if you are new to regression,

play03:30

or are still trying to figure out exactly what it even is,

play03:34

this video is for you.

play03:36

So sit back, relax, and let's go ahead and get to work.

play03:44

So as always, I like starting out my videos with a problem,

play03:47

and a relatively real world problem at that.

play03:50

So we'll call this one tips for service.

play03:54

So let's assume that you are a small restaurant owner,

play03:57

or a very business-minded server or waiter

play04:00

in a nice restaurant.

play04:02

Here in the US, tips are a very important part

play04:06

of a waiter's pay.

play04:08

Most of the time, the dollar amount of the tip

play04:11

is related to the dollar amount of the total bill.

play04:16

So if the bill is $5, that would have a smaller tip

play04:20

than a bill that is $50.

play04:24

Now as the waiter or the owner,

play04:26

you would like to develop a model

play04:29

that will allow you to make a prediction

play04:31

about what amount of tip to expect

play04:34

for any given bill amount.

play04:37

So therefore, one evening, you collect data for six meals.

play04:42

So a random sample of six meals.

play04:49

But unfortunately, when you begin to look at your data,

play04:52

you kind of forgot something.

play04:54

You realize you collected data for the tip amount

play04:57

and not the meal amount that goes with it.

play05:00

So unfortunately right now,

play05:02

this is the best data you have.

play05:04

So you have a random sample of six meals

play05:06

and the tip amount for each one of those meals.

play05:09

So $5, $17, $11 and so on.

play05:13

Now here's the question.

play05:15

How might you predict the tip amount for future meals

play05:21

using only this data?

play05:24

There's only one variable here, the tip amount.

play05:27

The meal number's just a descriptor.

play05:29

So we have one variable, the tip amount.

play05:32

But I still want to challenge you to come up with a model

play05:36

that will allow you to predict within some reason

play05:41

what the next tip is going to be.

play05:43

How can you do that?

play05:44

Think about it.

play05:48

So the first thing we're gonna do

play05:49

is we're going to visualize our data.

play05:51

As you know if you watch my other videos,

play05:53

I am a huge advocate of visualizing our problems,

play05:57

making charts, graphs, diagrams, whatever we have to do

play06:01

to make them visual.

play06:03

So the first thing we'll do is we'll make a graph

play06:04

of our tips.

play06:06

Now on the x-axis on the bottom, we have our meal number.

play06:09

Now that's not a variable,

play06:11

that's just a descriptor of what meal we're graphing.

play06:15

Now on the y-axis, or the vertical axis,

play06:17

that's where we will graph our tip amount.

play06:20

Let's go ahead and see what this looks like.

play06:22

So for meal one, with a tip of $5,

play06:25

so we'll go ahead and graph that at around $5.

play06:29

For meal two, with a tip of $17, so that goes way up there.

play06:33

For meal three, with a tip of $11, so that goes there.

play06:38

Meal four, with a tip of $8, that goes there.

play06:42

Meal five, that was a $14 tip.

play06:44

And meal number six, that was a $5 tip.

play06:47

So here are our data points.

play06:49

Remember, we're only dealing with one variable,

play06:51

that's the tip amount,

play06:52

and the meals along the bottom just describe

play06:54

where we're graphing each point.

play06:56

And the order does not matter.

play06:57

We could have graphed these in any order.

play07:00

This just happens to be the one we ended up with.

play07:04

Now, what's really the most you can figure out

play07:08

about this data?

play07:10

How would you predict what the tip for

play07:13

meal number seven would be?

play07:16

Is it going to be like meal number six, it's $5?

play07:19

Is it gonna be like meal number two, to $17?

play07:23

How would you come up with the best guess or estimate

play07:27

for the next meal using only one variable?

play07:30

Well, you would use its mean.

play07:34

So the mean for all six tips is $10.

play07:39

So guess what?

play07:40

That's the best we can do.

play07:42

With only one variable, the best estimate

play07:45

for the best prediction,

play07:47

for any given meal tip is $10.

play07:52

So go ahead and put a line at $10.

play07:55

So that for this model, that is our best fit line,

play08:00

that's all we have.

play08:01

One variable, tip amount, the mean is the best predictor

play08:04

of any given tip amount.

play08:07

Now obviously if you look at this chart,

play08:10

our tips do not fall on the $10 line,

play08:14

they're scattered around it.

play08:16

But still, it's the mean.

play08:18

So that's your best estimate for the next tip

play08:21

for any given tip would be.

play08:27

So here's our graph again with our tips, our mean,

play08:29

and our tip amount.

play08:31

I just want to stress that the tip amount is y bar,

play08:34

so that's the mean of y, and that's for two reasons.

play08:38

One, the dependent variable,

play08:40

which it will be as we progress forward

play08:42

is always the y of the x and y axes,

play08:46

and of course we're graphing it on the y-axis,

play08:48

so it should be y bar.

play08:51

So here it is, the basic concept I really want

play08:53

you to remember in your head as you go forward.

play08:56

But obviously, simple linear regression

play08:59

is about two variables.

play09:01

But, we're starting off here,

play09:03

'cause this is where it all begins.

play09:05

With only one variable and no other information,

play09:10

the best prediction for the next measurement

play09:13

is the mean of the sample itself.

play09:18

So the variability in the tip amount,

play09:20

'cause they're not on the line, they're above and below,

play09:23

the variability in the tip amounts can only be explained

play09:27

by the tips themselves because that's all we have.

play09:31

So the way they're above and below the line,

play09:33

that's just the natural variation in the tips.

play09:37

But the basic point is this;

play09:39

With only one variable, the best way, the only way

play09:44

we can make a prediction about what the next tip amount

play09:47

in this case is the mean.

play09:50

So our best prediction for the tip

play09:54

of meal of number seven is $10.

play10:01

So let's talk about the goodness of fit

play10:04

for this line and our tips.

play10:06

Now obviously we know that the data points,

play10:08

the actual observed values do not fall on that line,

play10:12

they do not fall on the $10 line,

play10:15

some are above and some are below it.

play10:18

So that tells us how good this line

play10:21

fits these observed data points.

play10:24

Now one way we can do that

play10:25

is to measure the distance they are

play10:28

from that best fit line.

play10:31

Now we did this to some degree when we were talking about

play10:35

standard deviation.

play10:37

Remember, we're talking about the distance

play10:39

each data point is from the mean.

play10:42

But guess what we're doing here?

play10:44

The distance that each data point is from the mean,

play10:47

because the mean is our line of $10 here.

play10:50

So, for meal number one, our tip was $5.

play10:55

so that's $5 below our mean of $10, so that's negative five.

play11:00

Meal number two, got a tip of $17,

play11:03

that was $7 above our mean.

play11:06

Meal three was $11, $1 above our mean.

play11:09

Meal four was $8, that's two below our mean.

play11:14

Meal five was $14, that's four above our mean.

play11:17

And meal six is $5, that's five below our mean.

play11:21

So these are the distances, in this case, dollar amounts

play11:25

by which each observed value is different from

play11:29

or is, deviates from

play11:32

the mean of $10.

play11:36

Now we have a name for these,

play11:37

they're called residuals.

play11:40

So the distance between the best fit line,

play11:44

which in this case, 'cause it's one variable is $10,

play11:48

the distance from the best fit line to the observed values

play11:53

are called residuals.

play11:55

Now they're also called the error.

play11:58

So the distance is also called the error because

play12:01

that's how far off the observed value is

play12:04

from the best fit line.

play12:06

Now you notice a few more things here.

play12:10

If you add up the residuals on the top,

play12:12

just above the line, seven plus one plus four, that's 12.

play12:16

Add up the residuals below the line,

play12:18

five, two and five, so that's minus 12.

play12:23

So the residuals always add up to zero.

play12:28

Now that's another important concept to keep in mind

play12:31

as we go forward.

play12:35

But if you remember in standard deviation,

play12:38

one of the steps was that we took the deviations

play12:40

from the mean and we squared them.

play12:43

Well guess what?

play12:45

We're gonna do the exact same thing here.

play12:48

So the residual for meal one one was $5,

play12:51

so it's $5 below, so we square that and it squares to 25.

play12:56

Meal number two, it was $7 above,

play12:59

we square seven, that's 49.

play13:01

So on and so forth.

play13:03

So the right-hand column of our table,

play13:05

we have our squared residuals.

play13:07

Now the question is why do we square them?

play13:10

Well we square them for the same reasons

play13:13

we square the deviations when calculating

play13:15

the standard deviation.

play13:17

Number one, it makes them all positive.

play13:20

So if we square a negative number,

play13:22

it obviously makes it positive.

play13:24

And number two, it emphasizes the larger deviations.

play13:29

So a deviation of two will square to four.

play13:32

But a deviation of five will square to 25.

play13:37

So the squaring really exaggerates

play13:39

the points that are further away.

play13:43

Now what we can do is we can take these residuals,

play13:45

these squared residuals in the right-hand column

play13:48

and we can add them up.

play13:51

And they're called the sum of squared residuals,

play13:55

or the sum of squared errors, or the SSE.

play14:01

Now where have you heard that before?

play14:03

Well you've heard it everywhere in statistics.

play14:07

You've obviously heard it in standard deviations,

play14:09

you've heard it in ANOVA.

play14:11

Same idea, sum of the squared errors.

play14:17

It's a fancy way of saying we add up the squared residuals.

play14:21

And when we do so, it's 120.

play14:28

Now when we say squaring the residuals,

play14:31

we literally mean squaring them.

play14:35

So, 25 over here in the left-hand side,

play14:38

that's negative five squared.

play14:40

49 is seven squared, and so forth.

play14:43

Well we actually mean squares,

play14:46

so when we square each residual, or error,

play14:50

we're actually making squares.

play14:55

So when we say sum of squares,

play14:58

we literally mean the sum of squares.

play15:02

So 49 plus 25 plus one plus four plus 16 plus 25

play15:06

adds up to 120.

play15:10

Now, here is sort of the blockbuster bombshell concept

play15:14

of this video.

play15:17

The goal of simple linear regression

play15:20

is to create a linear model that minimizes

play15:24

the sum of squares of the residuals,

play15:27

same thing as the sum of squares of the error.

play15:30

So what we're gonna do is we're gonna create

play15:33

a different line through the data,

play15:36

once we introduce an independent variable that will minimize

play15:42

the size of these squares.

play15:44

And actually mathematically,

play15:46

we'll come up with the line through the data

play15:48

that minimizes these squares as much as they can be.

play15:54

And that will be our best fit line for the data.

play15:57

But again, in this problem, we're only using one variable,

play16:00

we're only using the dependent variable.

play16:03

So when we introduce the independent variable,

play16:06

it will sort of take away for its own self

play16:10

some of this error we see here.

play16:13

If our regression model is significant,

play16:16

it will eat up some of the raw error we had

play16:20

when we assumed, like in this problem,

play16:23

that the independent variable did not even exist.

play16:28

So what we're doing here in this problem,

play16:30

we're taking a simple linear regression problem

play16:34

that in theory has a independent variable,

play16:38

called the bill amount,

play16:40

and a dependent variable called the tip amount.

play16:43

But what we're doing is pretending that the

play16:46

bill amount doesn't even exist.

play16:49

We're only using the tip amount.

play16:51

So, that creates a sum of squared residuals of 120.

play16:58

Now, when we introduce the independent variable of

play17:03

bill amount, what will happen is that we'll create

play17:07

a different best fit line through our data.

play17:12

And what it will do is it will sort of

play17:14

eat up some of this sum of squares.

play17:18

So when we do regression,

play17:19

we're gonna have sum of squares regression

play17:23

and sum of squares error.

play17:26

So by introducing that independent variable of bill amount,

play17:30

it will create a new line that goes through the data.

play17:32

That new line will explain some of the sum of squares,

play17:36

and therefore it will reduce the SSE down,

play17:40

the sum of these squares as much as it can be.

play17:44

So the regression line will and should

play17:47

literally fit the data better.

play17:51

It will minimize the residuals.

play17:56

So when conducting simple linear regression

play17:59

with two variables, we will determine how good that line

play18:03

fits the data by comparing it to this type,

play18:08

where we pretend the second variable does not even exist.

play18:13

So when we say a model is good,

play18:17

a linear regression model is good,

play18:21

what we're saying is that it reduces the sum of squares

play18:24

of the error by a large amount.

play18:28

Which is another way of saying

play18:30

we're comparing the other best fit line

play18:33

to this one you're looking at right here.

play18:37

Simple linear regression is always in comparison

play18:40

to what we would have if we only had the dependent variable.

play18:46

So if a two variable regression model

play18:47

looks like this example,

play18:49

what does the other independent variable do

play18:53

to help us explain the dependent variable?

play18:56

Well, it does nothing.

play18:58

If we introduced bill amount into a two variable

play19:02

simple linear regression, but the best fit line

play19:06

looks exactly like this,

play19:08

then the bill amount didn't give us anything.

play19:11

It didn't explain the variability in the tip amount

play19:16

anymore than the tip amount itself did.

play19:19

So we're always comparing our simple linear regression

play19:22

best fit line to this one.

play19:26

Basically, the mean of the dependent variable alone.

play19:34

Okay, so quick review.

play19:36

So simple linear regression

play19:38

is really a comparison of two models.

play19:40

The first one is where the independent variable

play19:42

does not even exist and we just use the mean

play19:45

of the dependent variable, like we did in this video.

play19:48

And the other use uses the best fit regression line,

play19:52

where we go ahead and introduce that second variable,

play19:55

the independent variable in this case, the meal amount,

play19:58

and that creates a different line,

play20:00

and then we compare that to the first one.

play20:05

But if there's only one variable like in this example,

play20:08

for this video, the best prediction for other values

play20:11

is the mean of that dependent variable.

play20:15

In this case, it was $10.

play20:17

Now the difference between the best fit line

play20:20

and the observed value is called the residual, or the error.

play20:26

The residuals are squared and then added together

play20:30

to generate a sum of squares,

play20:32

literally residuals or errors, or SSE.

play20:36

So we square the residuals and add them together,

play20:38

sum of squared residuals,

play20:40

or most often it's called sum of squares error.

play20:43

So simple linear regression is designed

play20:45

to find the best fitting line through the data

play20:49

that minimizes the SSE,

play20:52

that minimizes the area of the sum of squares residuals,

play20:56

that minimizes the area of the sum of squares error.

play21:00

And actually through calculus, it is the best fitting line.

play21:04

Now I'm not going to go into the calculus behind that,

play21:07

but you're just gonna have to start trusting me on faith

play21:10

that when we come up with a best fit line

play21:13

in simple linear regression, that literally is the

play21:17

best fit line that reduces the SSE.

play21:23

Okay, so that wraps up our very first video of mini

play21:26

on simple linear regression.

play21:28

So I just want you to realize in this video

play21:30

that later when we talk about the best fit line

play21:33

in regression, we're actually comparing it to the situation

play21:37

where we don't have the independent variable at all.

play21:40

We're just comparing it to the case,

play21:42

where we're looking at the mean of the dependent variable.

play21:46

So in this case, in this video,

play21:48

all we had was the mean of the tips, 10 bucks,

play21:51

that's all we had to go on.

play21:53

So therefore, our best guess or best prediction

play21:56

for the next tip was $10.

play21:58

Now later, when we introduced the meal amount,

play22:01

what will happen is we'll get a different best fit line

play22:04

that will explain or take up some of that error

play22:08

in the regression, it'll reduce the error,

play22:11

we'll have a different line,

play22:12

then we'll have smaller, hopefully, residuals.

play22:15

If the regression line is flat across,

play22:19

like we saw in the first example of this one,

play22:21

then the regression doesn't tell us anything,

play22:24

the meal amount doesn't mean anything,

play22:27

so the best guess is really just the mean of the tips.

play22:31

So, we'll go more into this example in the second video,

play22:34

just wanted to lay the foundations for that.

play22:36

Look forward to seeing you next time.

play22:38

(gentle acoustic guitar music)

Rate This

5.0 / 5 (0 votes)

Связанные теги
StatisticsRegressionData AnalysisPredictive ModelingEducationalMath TutorialBusiness InsightsStatistical LearningData VisualizationMachine Learning
Вам нужно краткое изложение на английском?