How To Tell When Support Will Break? (Must Watch)
Summary
TLDRThis video script delves into price action trading strategies, focusing on support and resistance levels. It explains the significance of 'power moves' and 'crawler moves' in predicting price reversals or breakdowns. The presenter shares insights on entry and exit strategies using bearish engulfing patterns, Fibonacci extensions, and moving averages. Additionally, the script hints at a comprehensive trading guide available for purchase, promising to unlock more advanced techniques for consistent profitability.
Takeaways
- 📈 The speaker introduces two types of price movements at support or resistance levels: 'power moves' and 'crawler moves', which are significant for predicting price reversals or breakdowns.
- 🔴 A 'power move' is characterized by large bearish or bullish candlesticks approaching support or resistance, indicating a potential swift reversal in the market.
- 🔵 A 'crawler move' is identified by a series of lower highs approaching support or higher lows approaching resistance, suggesting a weakening trend and possible breakdown or breakout.
- 💡 Traders often take profits when a strong move into support or resistance occurs, creating buying or selling pressure that can influence price movements.
- 📉 The fear of giving back profits can lead traders to exit positions, contributing to buying pressure that might push prices higher after a power move into support.
- 📊 The absence of immediate obstacles after a strong move into support or resistance can result in a rapid price reversal, as there's no immediate resistance to counter the move.
- 📌 The speaker emphasizes not trading every power move due to the need for additional confirming factors before entering a trade.
- ✅ The script illustrates a trading strategy using a bearish engulfing pattern as an entry trigger and the ATR indicator to set stop-loss levels.
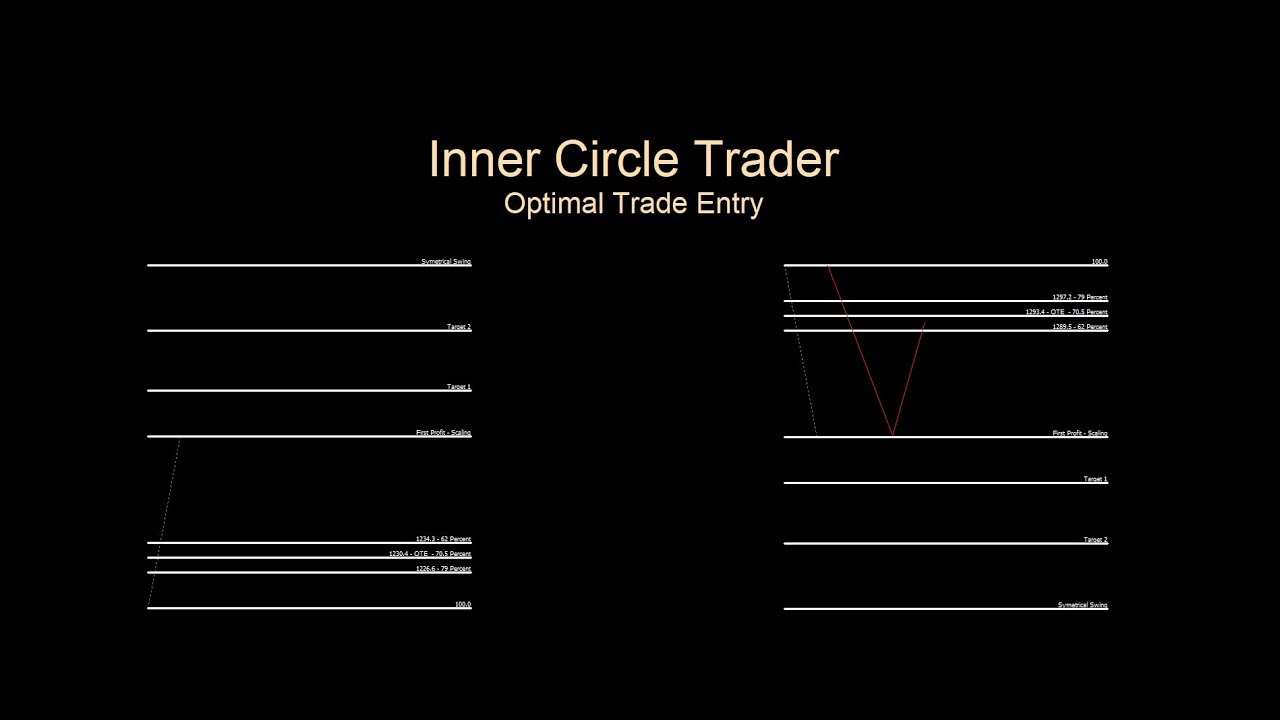
- 🔍 The Fibonacci extension tool is introduced to identify potential exit points by projecting price movements beyond the immediate support or resistance levels.
- 🌐 The strategies discussed are applicable across various timeframes, from the four-hour chart to the weekly chart, demonstrating the flexibility of the trading approach.
- 📚 The speaker promotes a book, 'Price Action Trading Secrets', which delves deeper into strategies for consistently profitable trading, including risk management and breakout trading techniques.
Q & A
What are the two types of moves discussed in the script when the price approaches support or resistance?
-The two types of moves are 'power move' and 'crawler move'. A power move is characterized by a series of large bearish or bullish candles approaching support or resistance, respectively. A crawler move is indicated by a series of lower highs into support or higher lows into resistance, showing a gradual weakening of the price movement.
Why is a power move significant when it comes to trading?
-A power move is significant because it can lead to a swift reversal in the market. Traders who are in profit may fear giving back their gains and look to take profits, inducing buying pressure. Additionally, technical traders may see the price at a support or resistance level and decide to enter trades, further increasing buying or selling pressure. Lastly, if the next obstacle (resistance or support) is far away, it allows for a potential large move in the direction of the power move without immediate obstacles.
What does a crawler move into support indicate about the market sentiment?
-A crawler move into support indicates a sign of weakness in the market. It shows that selling pressure is increasing as sellers are willing to sell at lower prices, suggesting they expect support to break. This can lead to a breakdown in price as new traders may place their stop losses just below the support level, which, if triggered, can add to the selling pressure.
How can a trader use the Fibonacci extension tool to set a target for a trade?
-A trader can use the Fibonacci extension tool to project where the price might go after a breakout or a significant move. By drawing the tool from a swing high to a swing low and then back to a higher high, traders can look to exit just before the 127% extension level, which is considered a common retracement level where the price may consolidate or reverse.
What is the strategy for entering a trade when the market is in a downtrend and approaching resistance?
-When the market is in a downtrend and approaching resistance, a trader can look for a valid entry trigger such as a bearish engulfing pattern or a false break above resistance. The trade is entered on the next candle open after the trigger. The stop loss is set a distance away from the resistance, using the ATR indicator to determine the distance, and targets are set at recent swing lows or using the Fibonacci extension tool for a more aggressive target.
How does the concept of a 'failed breakout' relate to setting a stop loss in a trade?
-A 'failed breakout' occurs when the market breaks a level of support or resistance but then reverses back into the previous range. To set a stop loss in such a scenario, a trader might place it just below the resistance level if going long, assuming that if the breakout fails and the price returns to the range, the trade should be closed to limit losses.
What is the reasoning behind not moving a stop loss to breakeven too early in a trade?
-Moving a stop loss to breakeven too early in a trade can be risky because there is no immediate obstacle to prevent the market from reversing and hitting the stop loss, especially if the trade is in an area of resistance. It's better to leave the stop loss at a logical level to give the market room to move and potentially hit a more favorable target.
How can a trader identify a potential trading opportunity in a market that is not breaking out but consolidating?
-In a market that is not breaking out but consolidating, a trader can look for a power move into an area of support. This could indicate a potential reversal and buying opportunity, aiming to capture a swing up to the resistance level. Traders might look for bullish reversal candlestick patterns like a hammer as a signal to enter such a trade.
What is the importance of managing risk and setting targets in trading as discussed in the script?
-Managing risk and setting targets are crucial in trading to protect capital and ensure that trades are executed with a clear plan. This includes setting stop losses to limit potential losses and setting multiple targets to take profits at different levels, which can help in securing profits while allowing for the potential of larger gains.
How can a trader determine the strength of a market trend using the concepts discussed in the script?
-A trader can determine the strength of a market trend by observing the price action near support and resistance levels. A series of higher lows into resistance indicates buying strength, suggesting the market is likely to break out higher. Conversely, a series of lower highs into support indicates selling pressure and potential weakness, suggesting the market may break down.
Outlines

Этот раздел доступен только подписчикам платных тарифов. Пожалуйста, перейдите на платный тариф для доступа.
Перейти на платный тарифMindmap

Этот раздел доступен только подписчикам платных тарифов. Пожалуйста, перейдите на платный тариф для доступа.
Перейти на платный тарифKeywords

Этот раздел доступен только подписчикам платных тарифов. Пожалуйста, перейдите на платный тариф для доступа.
Перейти на платный тарифHighlights

Этот раздел доступен только подписчикам платных тарифов. Пожалуйста, перейдите на платный тариф для доступа.
Перейти на платный тарифTranscripts

Этот раздел доступен только подписчикам платных тарифов. Пожалуйста, перейдите на платный тариф для доступа.
Перейти на платный тарифПосмотреть больше похожих видео


5.0 / 5 (0 votes)
