Manipulação de dados e gráficos | Unidade 3
Summary
TLDRIn this engaging lesson, Kisi Terra explores how data and graphs can be manipulated to spread climate misinformation, even when based on true information. She explains the distinctions between data, information, and knowledge, and highlights common manipulation strategies, including misleading scales, selective data cuts, inappropriate graph types, and manipulative aesthetics. Using real-world examples, such as inflation graphs and temperature trends, she demonstrates how visuals can distort perception. The video equips viewers with critical analysis skills to evaluate data sources, graph accuracy, and context, promoting informed interpretation and helping to recognize and resist misinformation effectively.
Takeaways
- 😀 Data, information, and knowledge are distinct: data are raw facts, information is contextualized data, and knowledge is the application of information.
- 📊 Even true data can be manipulated visually to create misinformation.
- ⚠️ Misinformation often arises from distorted interpretation or presentation of otherwise accurate data.
- 📏 Misleading scales in graphs can make smaller values appear larger or exaggerate differences.
- ⏳ Selective data ranges or temporal cutoffs can distort trends and mislead viewers.
- 📈 Choosing inappropriate graph types (area or volume instead of line or bar) can exaggerate or understate differences.
- 🎨 Manipulative aesthetics—colors, orientation, or design elements—can influence perception and interpretation of data.
- 📰 Even trusted sources require critical evaluation: context, representation, and presentation matter as much as data source.
- 🌡️ In climate data, incomplete or selectively presented graphs can falsely downplay global warming trends.
- 🔍 To identify reliable graphs, examine context, source, temporal range, axis orientation, type of graph, aesthetic choices, and scale.
- 💡 Developing the ability to critically analyze graphs empowers individuals to detect misinformation and make informed decisions.
- 🌍 Visualizations like heat maps can effectively communicate complex data when used honestly and accurately.
Q & A
What is the main focus of this lesson on data manipulation?
-The lesson focuses on understanding data manipulation and the use of misleading graphs, specifically in the context of climate disinformation. It aims to teach how to critically analyze and identify manipulated data to avoid being misled by false information.
What is the difference between data, information, and knowledge as explained in the video?
-Data refers to raw facts, such as numbers or measurements. Information is data given context or meaning, making it interpretable. Knowledge is the application of information to make decisions or draw conclusions.
How can true data be manipulated to create disinformation?
-True data can be visually distorted in ways that change the perception of the information. For example, misleading graphs can be created by manipulating scales, axes, or time frames, leading to false conclusions and misinterpretations.
What are the four common strategies of data manipulation discussed in the video?
-The four strategies discussed are: 1) Misleading scales, where the proportions of the graph's axes are distorted. 2) Selective data clipping, where only certain time frames or data points are shown. 3) Using inappropriate types of graphs, such as area or volume graphs, which can exaggerate differences. 4) Aesthetic manipulation, where the visual design of the graph leads to misinterpretation.
How does misleading scale manipulation work in graphs?
-In misleading scale manipulation, the axis scales are altered so that differences between data points appear much larger or smaller than they actually are. For example, in a bar graph showing inflation, a smaller value can appear larger than a larger value if the scale is distorted.
What is 'selective data clipping' and how does it create disinformation?
-Selective data clipping involves showing only a portion of the data or a specific time frame to support a misleading narrative. For instance, showing temperature trends only up to 2000 could mislead people into thinking there is no ongoing global warming, ignoring more recent data that shows a clear increase in temperatures.
Why is the choice of graph type important in preventing disinformation?
-The type of graph chosen can greatly affect how easily data is misinterpreted. For instance, line graphs are better for comparing values, while area or volume graphs can exaggerate differences. Choosing the right type of graph ensures a more accurate representation of the data.
What is the role of aesthetics in data manipulation?
-Aesthetics can be used manipulatively by altering the visual appearance of a graph, such as changing the direction of axes or using distracting colors. These aesthetic choices can subtly influence how the viewer interprets the data, potentially leading to false conclusions.
How can we identify manipulated graphs or data?
-To identify manipulated data, look for inconsistent scales, misleading axes, selective data points, or inappropriate graph types. Additionally, be critical of the visual design—ensure the graph represents the data honestly and that the context and source of the information are clear.
Why is context and source reliability critical when analyzing graphs?
-Context provides necessary background to interpret the data correctly, while the source ensures the data's credibility. Without reliable context and trustworthy sources, data can be easily manipulated to support misleading conclusions, even if the data itself is accurate.
Outlines

このセクションは有料ユーザー限定です。 アクセスするには、アップグレードをお願いします。
今すぐアップグレードMindmap

このセクションは有料ユーザー限定です。 アクセスするには、アップグレードをお願いします。
今すぐアップグレードKeywords

このセクションは有料ユーザー限定です。 アクセスするには、アップグレードをお願いします。
今すぐアップグレードHighlights

このセクションは有料ユーザー限定です。 アクセスするには、アップグレードをお願いします。
今すぐアップグレードTranscripts

このセクションは有料ユーザー限定です。 アクセスするには、アップグレードをお願いします。
今すぐアップグレード関連動画をさらに表示
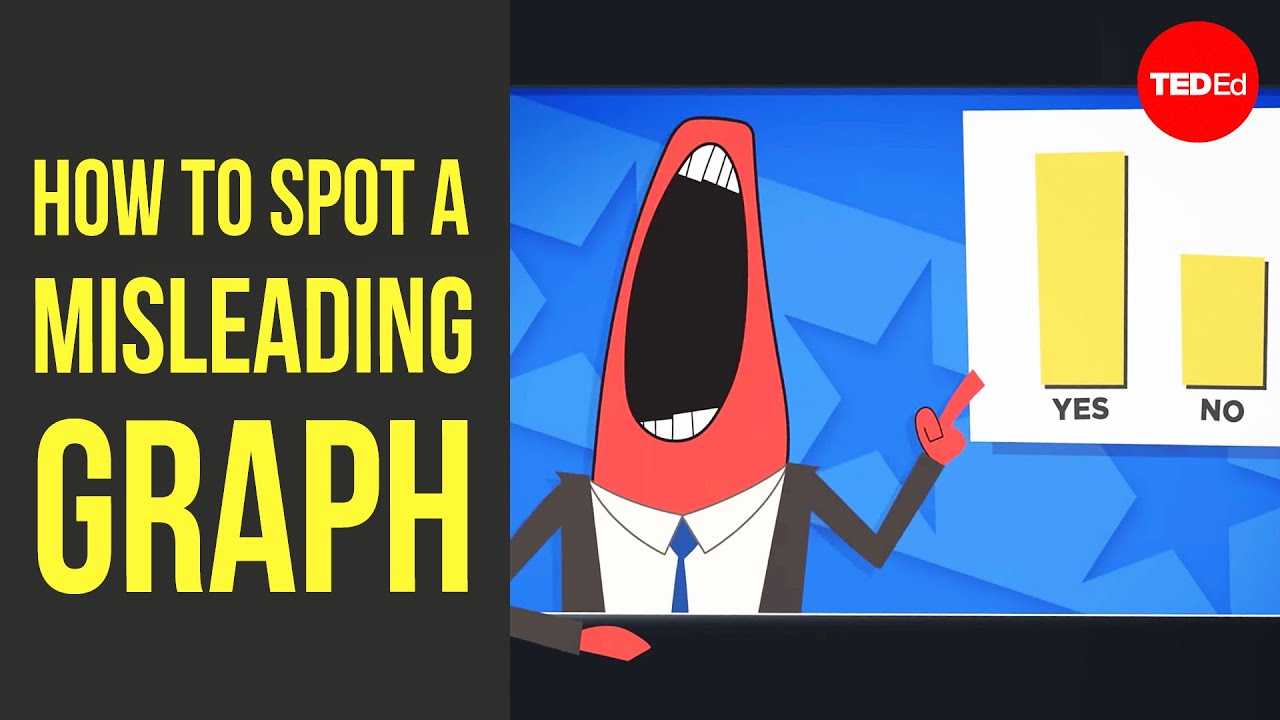
How to spot a misleading graph - Lea Gaslowitz

Como saber se uma fonte é confiável | Unidade 3

7 Common Types of Infographics

Analisis Hoaks Berbasis AI dalam Perspektif Pancasila dan Respon Sosial

The Real-World Danger of Online Myths | Vidhya Ramalingam | TED
AUDIO BAHASA INGGRIS UNTUK KELAS XI SMA/MA/SMK/MAK
5.0 / 5 (0 votes)
