ILLUSTRATING THE REJECTION REGION || STATISTICS AND PROBABILITY Q4
Summary
TLDRThis video lesson covers the concepts of hypothesis testing in statistics, focusing on rejection and acceptance regions, critical values, and one-tailed vs. two-tailed tests. It explains how to determine whether to reject or fail to reject the null hypothesis based on test statistics and critical values. The video walks through examples, such as a survey on social media usage and a drug trial, to demonstrate how to compute and interpret values like t-statistics and degrees of freedom. The goal is to help viewers understand statistical methods and their real-world applications, particularly in hypothesis testing.
Takeaways
- 😀 The rejection region (critical region) is the set of values that leads to rejecting the null hypothesis in hypothesis testing.
- 😀 The non-rejection region (acceptance region) is the set of values that causes us to fail to reject the null hypothesis.
- 😀 The critical value is a boundary in the test distribution used to compare against the test statistic.
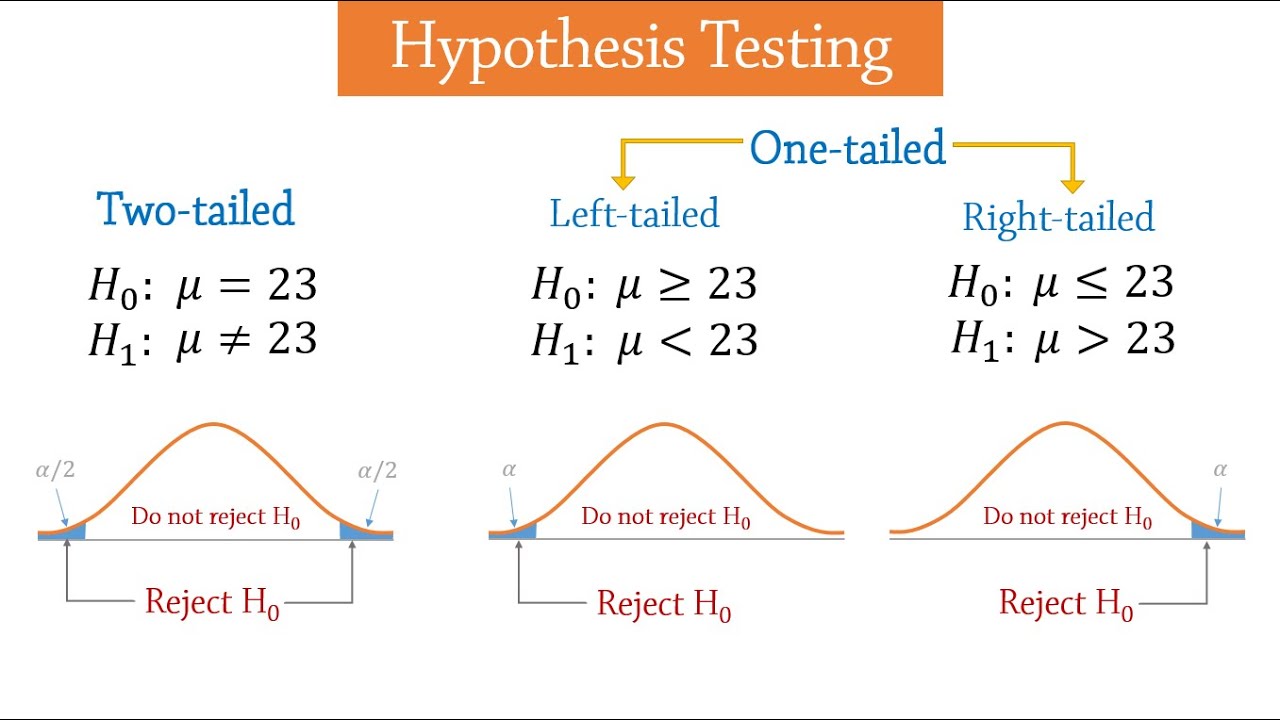
- 😀 For one-tailed tests, the rejection region is either on the left or right side of the distribution, depending on the direction of the alternative hypothesis.
- 😀 For two-tailed tests, the rejection region is on both sides of the distribution, with critical values at both ends.
- 😀 In hypothesis testing, alpha (α) represents the level of significance, which determines the critical values for one-tailed and two-tailed tests.
- 😀 The commonly used levels of significance are 0.05, 0.01, and sometimes 0.10, each with its corresponding critical values.
- 😀 A one-tailed test looks for a significant difference in one direction (either greater than or less than), while a two-tailed test checks for a difference in both directions.
- 😀 In the example with Sofia's survey, a one-tailed test was used to determine if her friends' average social media usage was significantly higher than the global average.
- 😀 The calculated test statistic (e.g., 1.593) is compared to the critical value (e.g., 1.833) to decide whether to reject the null hypothesis. In Sofia's case, the test result showed failure to reject the null hypothesis.
Q & A
What is the rejection region in hypothesis testing?
-The rejection region, also known as the critical region, is the set of all values of the test statistic that would lead to the rejection of the null hypothesis.
What is the non-rejection region in hypothesis testing?
-The non-rejection region, or acceptance region, is the set of all values of the test statistic that would cause us to fail to reject the null hypothesis.
How is the critical value determined in hypothesis testing?
-The critical value is a point or boundary on the test distribution that is compared to the test statistic to determine whether the null hypothesis should be rejected.
What is the difference between a one-tailed test and a two-tailed test?
-In a one-tailed test, the rejection region is located only on one side of the distribution (either left or right), based on the alternative hypothesis. In a two-tailed test, the rejection regions are on both sides of the distribution.
How do you determine the rejection region for a one-tailed test?
-For a one-tailed test, if the alternative hypothesis suggests that the value is greater than the population parameter, the rejection region is on the right side of the distribution. If the alternative hypothesis suggests that the value is less than the population parameter, the rejection region is on the left side.
What does it mean to fail to reject the null hypothesis?
-Failing to reject the null hypothesis means that the test statistic falls within the non-rejection region, indicating that there is insufficient evidence to support the alternative hypothesis.
How do you compute the test statistic for a one-tailed test?
-To compute the test statistic for a one-tailed test, you subtract the population mean from the sample mean, and then divide by the sample standard deviation divided by the square root of the sample size.
What is the importance of degrees of freedom in hypothesis testing?
-Degrees of freedom are important because they determine the distribution used to find critical values. It is typically calculated as the sample size minus one (n-1).
How do you interpret the critical value in hypothesis testing?
-The critical value serves as a threshold. If the computed test statistic is greater than (or less than, depending on the test) the critical value, the null hypothesis is rejected. If it is smaller, the null hypothesis is not rejected.
What is the significance of the level of significance (alpha) in hypothesis testing?
-The level of significance, denoted by alpha (α), is the probability of rejecting the null hypothesis when it is actually true. Common values for alpha are 0.05 and 0.01, which correspond to different critical values.
Outlines

このセクションは有料ユーザー限定です。 アクセスするには、アップグレードをお願いします。
今すぐアップグレードMindmap

このセクションは有料ユーザー限定です。 アクセスするには、アップグレードをお願いします。
今すぐアップグレードKeywords

このセクションは有料ユーザー限定です。 アクセスするには、アップグレードをお願いします。
今すぐアップグレードHighlights

このセクションは有料ユーザー限定です。 アクセスするには、アップグレードをお願いします。
今すぐアップグレードTranscripts

このセクションは有料ユーザー限定です。 アクセスするには、アップグレードをお願いします。
今すぐアップグレード


5.0 / 5 (0 votes)
