Risk Analysis - CompTIA Security+ SY0-701 - 5.2
Summary
TLDRThis script discusses methods for assessing risk levels, introducing both qualitative and quantitative risk assessments. It explains the use of a traffic light grid to visually represent risk levels and delves into the calculation of Annualized Rate of Occurrence (ARO), Asset Value (AV), Exposure Factor (EF), Single-Loss Expectancy (SLE), and Annualized Loss Expectancy (ALE). The importance of considering life, property, safety, and financial impacts is emphasized, along with the concepts of risk appetite and risk tolerance. The script also highlights the role of a risk register in documenting and managing project risks.
Takeaways
- 📊 Risk assessment involves evaluating various factors and can be done qualitatively or quantitatively.
- 🚦 A qualitative risk assessment uses a traffic light grid to categorize risks as low, medium, or high.
- 🔍 Individual risk factors are assessed for their impact, annualized rate of occurrence, and cost of controls.
- 💡 The overall risk level is determined by combining the individual factors' assessments.
- 💻 Legacy Windows clients are an example where the risk might be medium to high due to the need for updates.
- 📚 Untrained staff is another risk factor, with a low to medium overall risk depending on the impact and occurrence.
- 🛡 Devices without antivirus software pose a high risk due to medium impact and a large rate of occurrence.
- 🔢 Quantitative risk assessment uses specific values like Annualized Rate of Occurrence (ARO) and Asset Value (AV).
- 💰 The Single-Loss Expectancy (SLE) and Annualized Loss Expectancy (ALE) are calculated to determine financial risk.
- 🏢 Risk calculations consider the impact on life, property, safety, and finances.
- 🚦 Likelihood and probability are used to measure the chance of a risk occurring, with qualitative and quantitative measures.
- 🚫 Organizations have a risk appetite and risk tolerance, which define the level of risk they are willing to accept.
- 📋 A risk register documents the risks associated with a project, detailing each risk and providing solutions.
- 🔑 Assigning risk owners and determining risk thresholds are part of managing risks in a project.
Q & A
What is a qualitative risk assessment?
-A qualitative risk assessment evaluates individual risk factors and their criteria, often displayed in broad terms such as low, medium, or high risk.
How can a traffic light grid be used in risk assessment?
-A traffic light grid can be used to show the risk levels (low, medium, high) for different categories, helping to visualize and prioritize areas of concern.
What is the significance of marking the annualized rate of occurrence in red?
-Marking the annualized rate of occurrence in red signifies a high value, indicating that the risk occurs frequently and requires urgent attention.
What does an asset value (AV) represent in risk assessment?
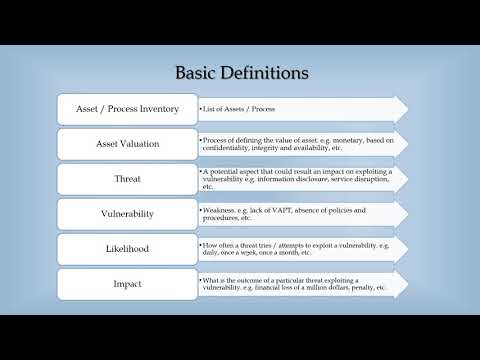
-Asset value (AV) represents the value of an asset to the organization, which may include replacement costs, impact on sales, fines, and other associated costs.
How is a single-loss expectancy (SLE) calculated?
-Single-loss expectancy (SLE) is calculated by multiplying the asset value (AV) by the exposure factor (EF), which represents the percentage of value lost due to a risk.
What does the annualized loss expectancy (ALE) indicate?
-Annualized loss expectancy (ALE) indicates the expected monetary loss over a year, calculated by multiplying the annualized rate of occurrence (ARO) by the single-loss expectancy (SLE).
Why are both qualitative and quantitative risk assessments important?
-Both types of assessments are important because they consider different aspects of risk, with qualitative assessments focusing on broad impacts and quantitative assessments on specific financial costs.
What is risk appetite and how does it differ from risk tolerance?
-Risk appetite is the level of risk an organization is willing to accept, while risk tolerance is the acceptable variance around that appetite. Risk tolerance is usually broader than risk appetite.
How can a risk register be useful in project management?
-A risk register documents individual risks associated with a project, detailing key risk indicators, assigning owners, and providing solutions to manage and mitigate these risks.
What is the purpose of assigning an owner to each risk in the risk register?
-Assigning an owner to each risk ensures accountability and responsibility, helping to manage and mitigate the risk effectively.
Outlines
🔍 Evaluating Risk Levels
Determining risk levels involves various variables. A qualitative risk assessment evaluates individual risk factors and criteria, often using broad terms. A traffic light grid (low, medium, high) can display these assessments. For example, legacy Windows clients might show medium impact and high annual occurrence, indicating a high overall risk. Untrained staff may have low impact but medium occurrence, resulting in a medium overall risk. Devices without antivirus software might have medium impact, high occurrence, and high overall risk. This process provides a high-level view of risks to prioritize efforts. Quantitative risk assessments, like calculating ARO (Annualized Rate of Occurrence) and AV (Asset Value), are also important. These assessments help determine specific values and financial impacts, such as calculating SLE (Single-Loss Expectancy) and ALE (Annualized Loss Expectancy). This combined approach ensures comprehensive risk evaluation, focusing on life, property, safety, and financial impacts.
🏢 Impact on Property and Safety
Risk assessments must consider property and safety impacts. Property refers to buildings and resources, while safety concerns the wellbeing of individuals and the organization. Financial impacts are also crucial, as seen in quantitative analyses. Risk likelihood is a qualitative measure (e.g., rare, possible), whereas risk probability is quantitative, often based on historical data and future expectations. These terms can be used interchangeably, with probability sometimes informing likelihood. Not all risks require action; some fall within the organization's risk appetite, a qualitative measure of acceptable risk levels. Risk tolerance, often broader than risk appetite, reflects the organization's willingness to accept risk variances. For instance, highway speed limits represent a risk appetite, while enforcement leniency indicates risk tolerance. Projects typically document risks in a risk register, detailing key risk indicators, responsible owners, and risk thresholds. Balancing the cost of risk mitigation with potential costs is essential for effective risk management.
Mindmap
Keywords
💡Risk Assessment
💡Qualitative Risk Assessment
💡Annualized Rate of Occurrence (ARO)
💡Asset Value (AV)
💡Exposure Factor (EF)
💡Single-Loss Expectancy (SLE)
💡Annualized Loss Expectancy (ALE)
💡Risk Appetite
💡Risk Tolerance
💡Risk Register
💡Key Risk Indicator
Highlights
Evaluating risk through a qualitative assessment by examining individual risk factors and criteria.
Using a traffic light grid to visually represent low, medium, or high risk levels for different categories.
Assessment of legacy Windows clients' risk with medium impact and high annualized rate of occurrence.
The cost of controls for risk factors is marked as medium, contributing to the overall high risk level.
Qualitative analysis of untrained staff risk with low impact, medium occurrence, and low control cost.
Risk assessment of devices without antivirus software, indicating a very high overall risk.
The process of qualitative analysis applied to various risk factors for a high-level view of problem areas.
Introduction to quantitative risk assessment starting with the Annualized Rate of Occurrence (ARO).
Assigning Asset Value (AV) to risks, considering the impact on company sales, fines, and other costs.
Understanding the Exposure Factor (EF) as the percentage of asset value lost due to a risk.
Calculating Single-Loss Expectancy (SLE) by multiplying Asset Value with Exposure Factor.
Estimating Annualized Loss Expectancy (ALE) by multiplying ARO with SLE for financial risk assessment.
Considering the value of data on stolen laptops beyond the financial cost in risk assessment.
Importance of life safety in risk assessment, prioritizing human safety over asset replacement.
Considering property, safety, and financial impacts in the evaluation of risk events.
Differentiating between likelihood and probability in risk assessment, with examples of qualitative and quantitative measurements.
Understanding an organization's risk appetite and risk tolerance, and their impact on risk management decisions.
Practical example of risk appetite and tolerance using the analogy of speed limits and driving habits.
Documentation of project risks in a risk register, detailing key risk indicators and solutions.
Assigning risk owners and determining risk thresholds to balance risk mitigation costs and potential impact.
Transcripts
Determining levels of risk can vary widely
on how many different variables are involved.
One way to evaluate risk may be to create a qualitative risk
assessment.
This type of evaluation will look at individual risk factors
and the different criteria for each one of those factors.
You can often display a qualitative risk assessment
in very broad terms.
In our particular case, we're going to use a traffic light
grid to show a low, medium, or high risk in each
of these categories.
We'll start with legacy Windows clients.
We may perform an assessment in our organization
and find that we have a medium-level impact
for that particular risk factor.
Our annualized rate of occurrence we'll
mark in red to signify a high value.
In this case, we may have a large number of legacy Windows
clients that need to be updated.
The cost of these controls would be
marked as a medium and overall risk
we can then set to be in the high level with the red marker.
We can perform additional qualitative analysis
on these other risk factors, such as untrained staff.
Maybe this has a very low impact,
has a medium-level annualized rate of occurrence,
a low cost of controls, which puts our overall risk somewhere
in the medium level.
And in our organization, we might
have cases where we have devices that have
no antivirus software running.
This may have a medium impact, have a large annualized
rate of occurrence, a medium cost of controls,
and we might set an overall risk value to be very high.
This process of setting qualitative analysis
can be done on any risk factor, across many different
categories, and it's designed to give us
a high-level view of where we might focus our efforts
to resolve these problems.
There may be certain risks where we can calculate
a specific value, we refer to these as a quantitative risk
assessment.
This might start with an ARO.
That stands for an Annualized Rate of Occurrence.
This allows us to determine how often this risk will
occur in a single year.
So for example, an annualized rate
of occurrence that a hurricane will hit
will probably be lower in Montana than it is in Florida.
We might also want to assign an Asset
Value to that risk, or AV.
The asset value is the value of that asset to the organization.
That doesn't necessarily mean it's
the replacement cost, because that asset value could include
the effect on company sales, any fines
that you might receive when that particular risk is realized,
and any other costs.
And another important value is the exposure factor.
The Exposure Factor is abbreviated with EF.
This is the percentage of the value that was lost
due to that particular risk.
So if we lose a quarter of that particular asset
the exposure factor is 0.25.
If we lose the entire asset, then the exposure factor
is 1.0.
Now, we can start calculating a quantitative risk assessment
based on some of those variables.
We'll start with the SLE, or Single-Loss Expectancy, which
is the monetary loss we receive if one single event occurs.
You can calculate this by taking the Asset Value, or AV,
and multiplying it by the Exposure Factor, or EF.
Let's take the example of laptops that are stolen.
If we have a laptop stolen, the rough asset value
is around $1,000, and since the entire asset is now missing,
the exposure factor is a full 1.0.
If we multiply that $1,000 value times the 1.0 exposure factor,
we have a single loss expectancy of $1,000.
In our organization, we can estimate
that there will be a number of laptops
stolen in a single year.
So to calculate the ALE, or Annualized Loss Expectancy,
we would multiply the Annualized Rate Of occurrence, ARO,
times the SLE, or Single-Loss Expectancy.
So if we expect there will be seven laptops stolen in a year,
that annualized rate of occurrence is 7,
and we multiply that times the single-loss expectancy
of $1,000, we have a total annualized loss
expectancy of $7,000.
Obviously, this calculation takes into account
the financial cost of this particular risk,
but there may be other risks associated with this.
For example, the data that's on those laptops
may be more valuable than the laptop itself.
That's why we have both a quantitative risk
assessment and a qualitative risk assessment
that we can evaluate.
We take into a number of different impacts
of events that may occur in our risk calculations.
The most important of these would be life.
We want to be sure that everyone in the organization is safe.
We can replace assets, but we can't replace people,
so we usually put life at the very top of our concerns.
We then also have to consider the impact to the property.
This would be the buildings and the resources
that we would commonly use in our organization.
We should also consider the impact of safety.
If there's a risky event, what type of safety impact
is this to the individuals and the company itself?
There's also, of course, a financial impact.
We discussed some of that with our quantitative analysis.
You've probably seen already that our risk calculations
tend to take into account likelihood and probability.
The likelihood of a risk is a qualitative value.
So we might consider a risk to be rare, possible, almost
certain, or some other type of qualitative measurement.
Risk probability tends to be a quantitative number.
So we can associate a statistic or a measurement
to that specific risk.
We can often base this on historical performance
and, in some cases, the performance
that we might expect into the future.
We will often use these two terms interchangeably,
and sometimes, we might even calculate a risk probability
and then associate a likelihood based on that value.
Not all risk requires an organization to act.
There may be a certain amount of risk
that the organization is willing to take.
We refer to that value as a risk appetite.
Some organizations will set a qualitative value
on this appetite.
We refer to this as a risk appetite posture.
So they might look at a particular risk
and say that they are conservative or neutral or
expansionary to that particular risk type.
Another important value to consider is the risk tolerance.
This is often a larger variance than the risk appetite.
So we might have a risk appetite that is relatively low,
and our risk tolerance might be just
above that particular appetite value.
Here's a practical example that differentiates between a risk
appetite and a risk tolerance.
If you're driving on the roads, there
is a speed limit for the highway.
Your speed limit might be 55 miles an hour.
That value has been set by the government,
and they know that is the acceptable balance
between safety and convenience.
That means that you are not allowed
to go over 55 miles an hour, and if you do,
you're violating the law.
So if we're driving on the highway,
and we exceed the speed limit, we could be ticketed.
In practical terms, however, we don't
tend to be ticketed until we go well above the speed limit
values.
This means, if we're not being ticketed,
and we're going over the speed limit,
that our law enforcement has a higher risk tolerance than they
have a risk appetite.
This risk tolerance might also change
depending on the situation.
If there's very bad weather, there
may be a need to keep the speeds lower on the highway,
and the risk tolerance of law enforcement
may have a much lower speed limit in mind.
It's not unusual for a project in an organization
to have a list of the risks associated with implementing
that particular project.
This is usually documented in a risk register,
and each individual risk is detailed
so that everyone understands the risks associated
with that project.
The goal of the risk register is to document
each of those individual risks, and if possible, provide
some options or solutions to avoid that risk.
Each line in the risk register will contain a key risk
indicator that details what those risks could be.
For example, in this project, the project purpose and need
is not well defined, the project design and deliverable
definition is incomplete, and the project schedule is not
clearly defined or understood.
Each one of those would be a key risk indicator.
For each of those key risk indicators
we need to assign an owner who will manage or be
responsible for that particular risk,
and then we need to determine what the risk threshold will
be for this project.
We need to spend time and money to be
able to resolve that particular risk,
and we need to make sure that there
is a balance between how much money we'll spend on the risk
and how much that risk would end up costing the company.
関連動画をさらに表示
CompTIA Security+ SY0-701 Course - 5.2 Explain Elements of the Risk Management Process - PART A
Cybersecurity Skills: Quantitative Risk Management
Risk of Material Misstatement
What is acceptable risk?
Risk and How to use a Risk Matrix
ISTQB FOUNDATION 4.0 | Tutorial 50 | Risk Identification | Risk Assessment | CTFL Tutorials
5.0 / 5 (0 votes)