SPtLDV (Sistem Pertidaksamaan Linear Dua Variabel) Kelas 10 Kurikulum Merdeka
Summary
TLDRThis video covers the topic of Sistem Pertidaksamaan Linear Dua Variabel (SPLDV), focusing on understanding and solving systems of linear inequalities with two variables. Viewers will learn how to identify the general form of SPTLDV, determine solution regions through graphical methods, and apply these concepts to real-world problems. A key example involves a bakery's production of cheese and chocolate bread, with constraints on available butter and flour. The video walks through the process of modeling the problem mathematically and finding feasible production limits using linear inequalities.
Takeaways
- 😀 The video focuses on learning about linear inequality systems with two variables (SPLDV), specifically how to determine their general form and solve them.
- 😀 The general form of an SPLDV involves inequalities such as less than, greater than, less than or equal to, or greater than or equal to, with linear variables.
- 😀 An SPLDV consists of two variables (x and y), and the system involves more than one linear inequality.
- 😀 To determine the solution region for an SPLDV, you need to first convert the inequality into an equation, graph it, and test the solution with specific points.
- 😀 If the inequality includes an equality (e.g., ≤ or ≥), the graph will have a solid line; otherwise, a dashed line is used.
- 😀 After graphing the lines, you conduct a point test to see if the area is shaded (solution region) or left unshaded (non-solution region).
- 😀 The intersection of the shaded areas from all inequalities is the solution region for the system.
- 😀 The example illustrates solving a system involving the inequalities 2x + 3y ≤ 6 and x - y ≤ 1, showing the step-by-step graphing and point testing.
- 😀 The video also explains how to model real-life problems as an SPLDV, such as determining production limits for two types of bread with given resource constraints.
- 😀 In the bakery example, constraints on butter and flour were used to formulate the inequalities representing production limits, with the goal of determining feasible production quantities of each type of bread.
Q & A
What is the main topic of this video?
-The main topic of the video is learning about the system of linear inequalities in two variables (SPLDV).
What are the key learning objectives of the video?
-The key learning objectives are: understanding the general form of linear inequalities in two variables, determining the solution region, and modeling real-life problems into SPLDV.
What does SPLDV stand for?
-SPLDV stands for Sistem Pertidaksamaan Linear Dua Variabel, which translates to a system of linear inequalities in two variables.
What is the general form of a linear inequality in two variables?
-The general form of a linear inequality in two variables consists of a linear expression in the form 'ax + by ± c' where the inequality sign can be less than, greater than, less than or equal to, or greater than or equal to.
How do you determine the solution region for a system of linear inequalities?
-To determine the solution region, first convert the inequalities into equations, then graph them. If the inequality includes 'less than or equal to' or 'greater than or equal to', use solid lines; if not, use dashed lines. Then, perform a test with a random point to determine which region satisfies the inequalities.
How do you graph an inequality like 2x + 3y ≤ 6?
-To graph the inequality 2x + 3y ≤ 6, first convert it into the equation 2x + 3y = 6. Then, plot the points where x = 0 (giving y = 2) and y = 0 (giving x = 3). Connect these points with a solid line since the inequality includes 'less than or equal to'. Finally, shade the region that satisfies the inequality.
What does the 'dashed line' indicate when graphing inequalities?
-A dashed line indicates that the points on the line are not included in the solution region. This occurs when the inequality does not include 'equal to' (e.g., 'less than' or 'greater than').
How do you test which side of the line to shade?
-To test which side to shade, choose a random point not on the line (e.g., (0,1)). Substitute the coordinates into the inequality. If the inequality is true, shade the side that contains that point. If false, shade the opposite side.
How do you handle boundary conditions in a system of inequalities?
-Boundary conditions are handled by ensuring the values for x and y satisfy the inequalities, meaning they can be equal to the boundary values or strictly less or greater than them, depending on the inequality signs.
Can you give an example of how a real-life problem can be modeled into an SPLDV?
-An example from the video involves a bakery producing two types of bread: cheese bread and chocolate bread. The bakery must manage resources like butter and flour. The quantities of these ingredients needed for each type of bread are translated into a system of linear inequalities to model the production constraints, ensuring the total amounts of butter and flour do not exceed the available limits.
Outlines

このセクションは有料ユーザー限定です。 アクセスするには、アップグレードをお願いします。
今すぐアップグレードMindmap

このセクションは有料ユーザー限定です。 アクセスするには、アップグレードをお願いします。
今すぐアップグレードKeywords

このセクションは有料ユーザー限定です。 アクセスするには、アップグレードをお願いします。
今すぐアップグレードHighlights

このセクションは有料ユーザー限定です。 アクセスするには、アップグレードをお願いします。
今すぐアップグレードTranscripts

このセクションは有料ユーザー限定です。 アクセスするには、アップグレードをお願いします。
今すぐアップグレード関連動画をさらに表示
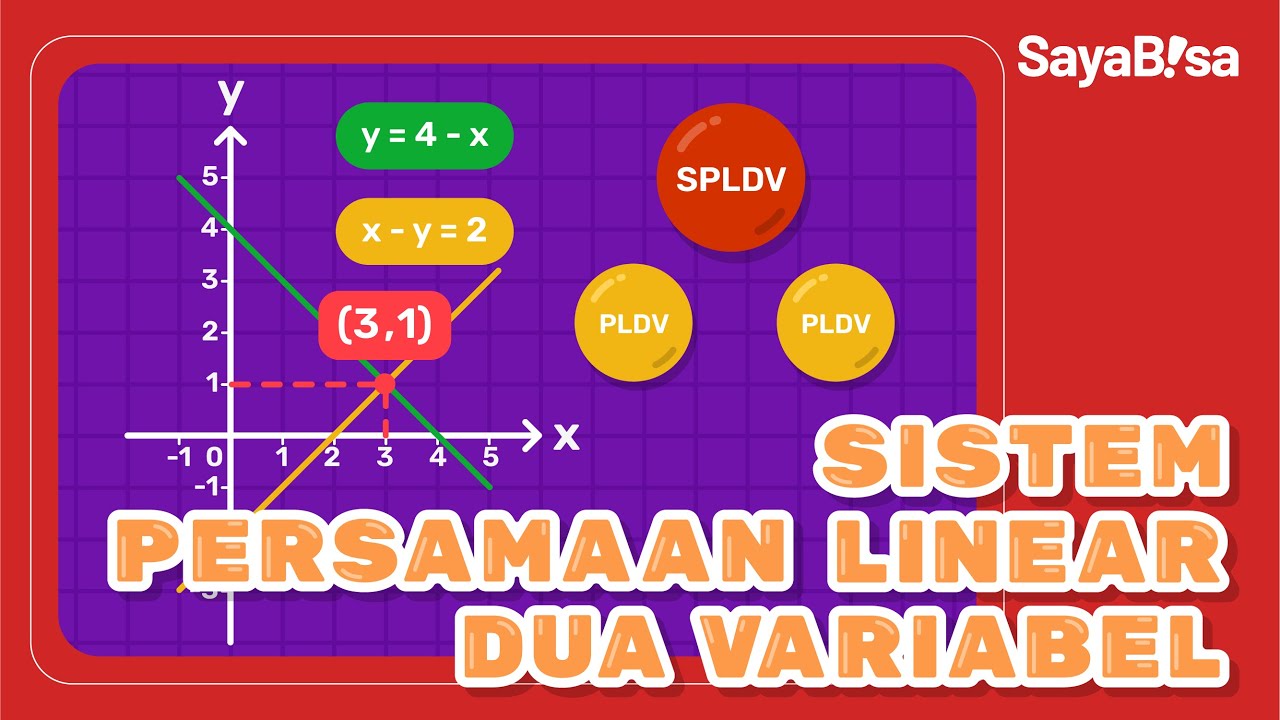
Sistem Persamaan Linear Dua Variabel | Matematika | SayaBisa
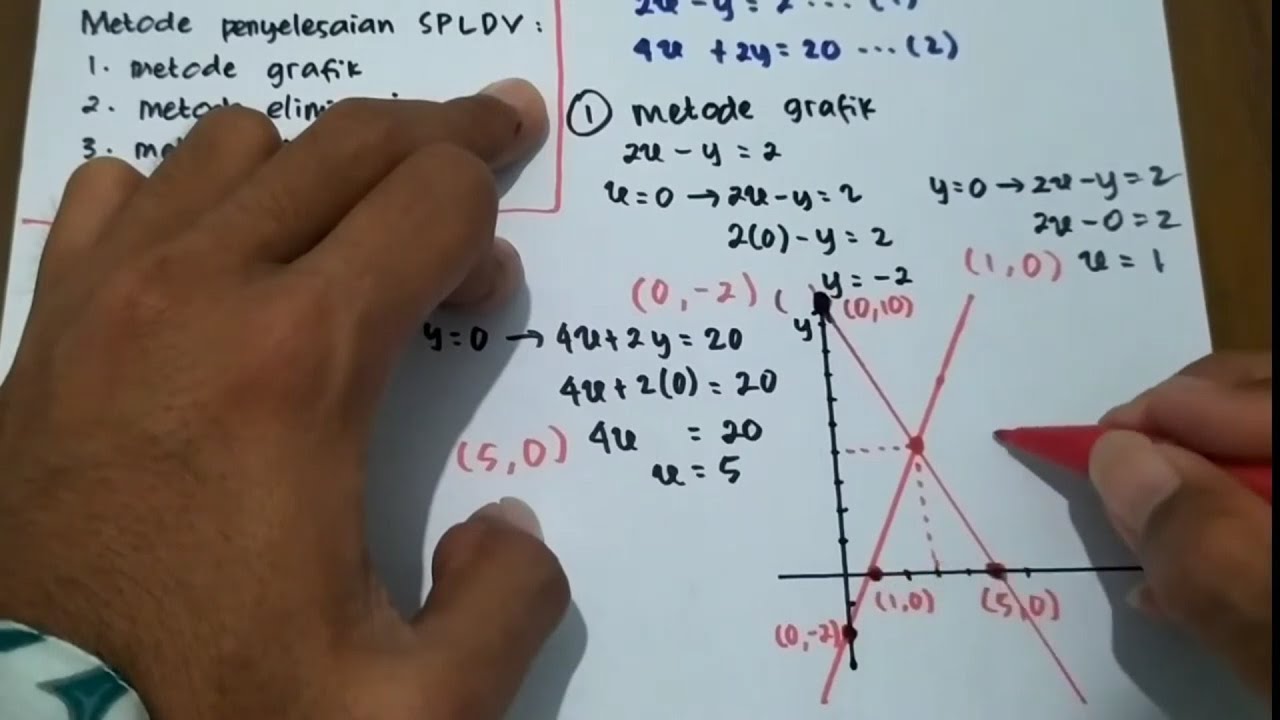
Sistem persamaan linear dua variabel kelas 10 - metode grafik
SPLDV [Part 1] - Mengenal SPLDV + Metode Grafik

Materi Matematika Kelas 8 : Sistem Persamaan Linear Dua Variabel (SPLDV)
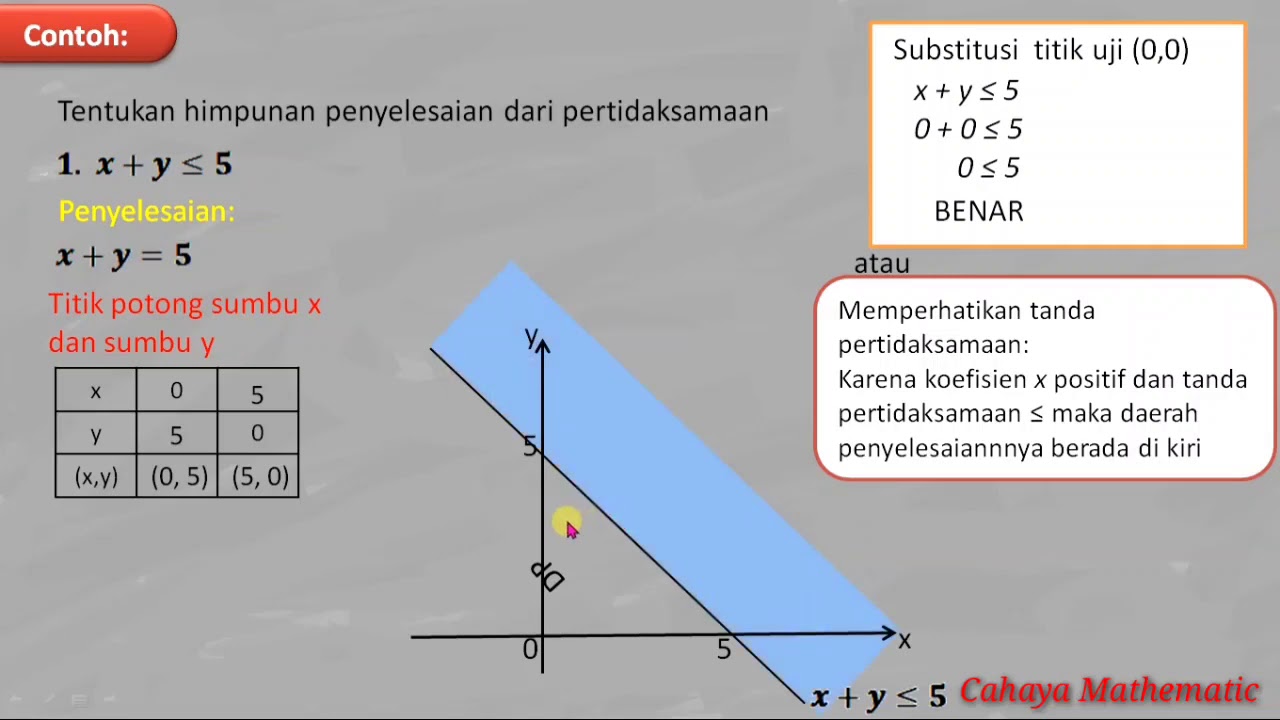
PERTIDAKSAMAAN LINEAR DUA VARIABEL
Matematika kelas X - Sistem Persamaan Linear part 1 - Sistem Persamaan Linear Dua Variabel (SPLDV)
5.0 / 5 (0 votes)
