Statistika • Part 2: Metode Pengumpulan Data dan Pengelompokan Data Tunggal
Summary
TLDRIn this video, the Science Window Channel explores the fundamentals of statistics, focusing on data collection and grouping. The video explains two primary methods of data collection: census, where data is collected directly from the population, and sampling, where a smaller group is selected to represent the population. It also covers the difference between primary data (gathered firsthand) and secondary data (obtained through intermediaries). The process of grouping data into single or grouped formats is demonstrated with examples. Finally, ranking and extreme statistics are discussed, along with the presentation of data in tables for easier analysis.
Takeaways
- 😀 Census data collection involves gathering data directly from the entire population.
- 😀 Sampling data collection is when data is collected from a subset of the population, not the entire group.
- 😀 Primary data is obtained directly from the research object, such as through experiments, surveys, or interviews.
- 😀 Secondary data is gathered from intermediaries, such as government institutions or media, and not directly from the research object.
- 😀 Data collection can be done through a census (entire population) or sampling (subset of the population).
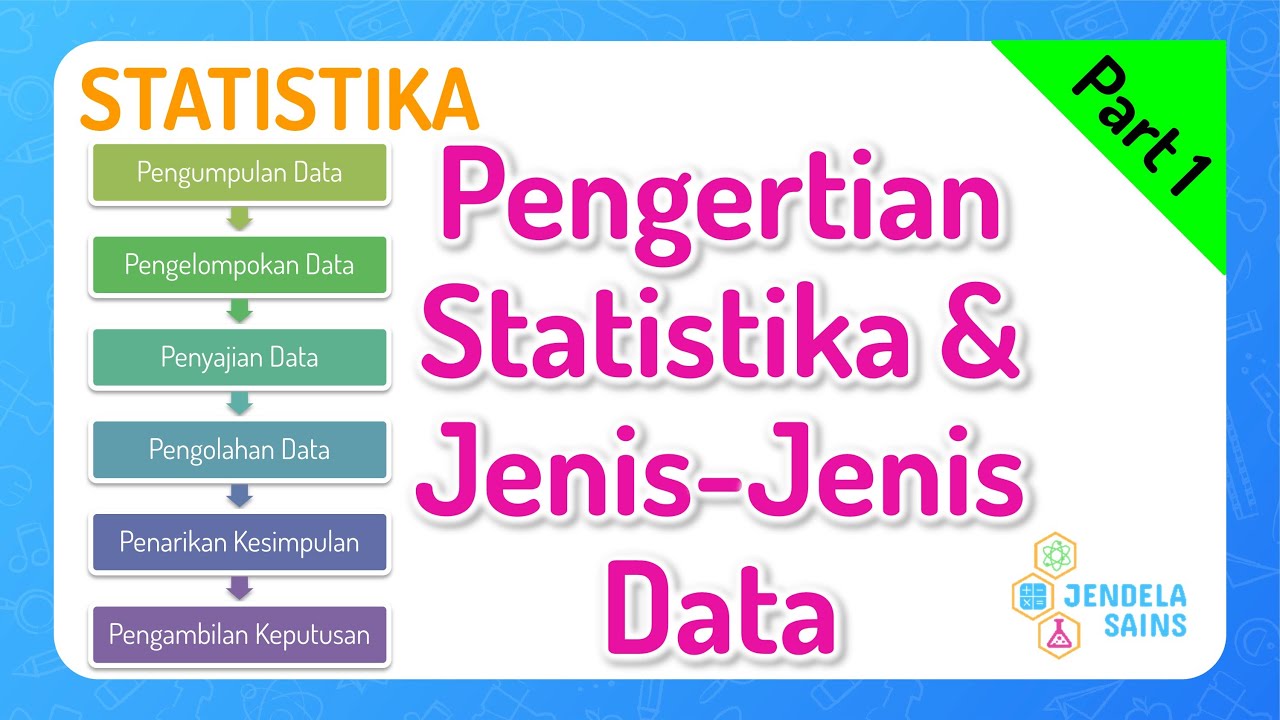
- 😀 Data can be grouped into single data (sorted from smallest to largest) or group data (organized into frequency distribution).
- 😀 When dealing with small variations in data, single data grouping is sufficient. Larger datasets may require grouping.
- 😀 Ranking statistics organize data from the smallest to the largest values.
- 😀 Extreme statistics shows the smallest (first) and largest (last) values in the dataset.
- 😀 Grouping data into ranges (e.g., 51-60, 61-70) simplifies the analysis of larger datasets, like test scores.
- 😀 Data presentation in tables helps visualize frequencies, making the data easier to understand and analyze.
Q & A
What are the two primary methods of data collection mentioned in the video?
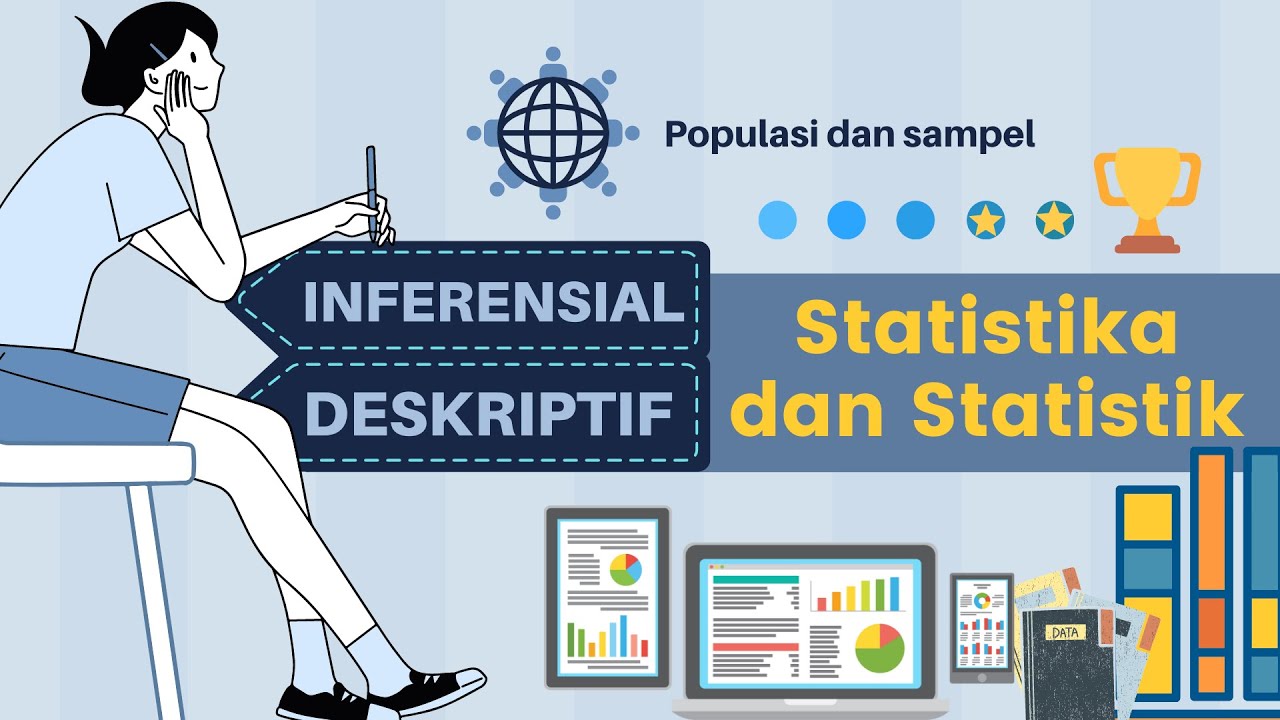
-The two primary methods of data collection discussed are census and sampling. A census involves collecting data directly from the entire population, while sampling involves selecting a subset of the population to gather data from.
How does the process of census data collection differ from sampling?
-In census data collection, information is gathered directly from every member of the population. In contrast, sampling involves collecting data from a selected portion of the population, which is smaller and more manageable than the entire population.
Can you give an example of when census data collection might be impractical?
-An example where census data collection would be impractical is when researching the daily gadget usage of high school students across Indonesia. Asking every student individually would be impossible due to the large population size, so sampling is used instead.
What is the difference between primary data and secondary data?
-Primary data is collected directly from the object of research without intermediaries, such as through experiments, interviews, or surveys. Secondary data, on the other hand, is obtained from intermediaries, such as government agencies, research institutions, or media sources.
What kind of data would be considered secondary data in the context of the video?
-Secondary data in the context of the video refers to data collected from intermediaries like the Central Bureau of Statistics (BPS) in Indonesia, where researchers use published data on topics like rubber exports or oil exports, rather than collecting the data directly themselves.
What is the process for grouping single data into group data?
-For single data, it is first sorted from the smallest to the largest. If the data shows a wide variation, grouping is done by creating ranges or intervals, such as test scores grouped into ranges like 51-60, 61-70, etc. This helps organize and analyze large data sets more efficiently.
Why is it more efficient to use grouped data for large data sets?
-Grouped data is more efficient for large data sets because it organizes the data into categories or intervals, making it easier to identify patterns, trends, and frequencies, instead of having to deal with each individual data point.
What are ranking statistics, and how are they used?
-Ranking statistics are used to sort data from the smallest to the largest. It helps in identifying the first and last values in a data set, such as determining the lowest and highest values or finding specific percentiles within the sorted data.
What are extreme statistics in the context of data analysis?
-Extreme statistics refer to the smallest and largest values in a data set, representing the first and last data points. For example, if you have 20 data points, X1 represents the smallest value, and X20 represents the largest value.
What is the purpose of presenting data in a frequency distribution table?
-The frequency distribution table is used to display how often different values appear in the data set. It organizes the data into categories or intervals, making it easier to analyze and interpret the distribution of values.
Outlines

Esta sección está disponible solo para usuarios con suscripción. Por favor, mejora tu plan para acceder a esta parte.
Mejorar ahoraMindmap

Esta sección está disponible solo para usuarios con suscripción. Por favor, mejora tu plan para acceder a esta parte.
Mejorar ahoraKeywords

Esta sección está disponible solo para usuarios con suscripción. Por favor, mejora tu plan para acceder a esta parte.
Mejorar ahoraHighlights

Esta sección está disponible solo para usuarios con suscripción. Por favor, mejora tu plan para acceder a esta parte.
Mejorar ahoraTranscripts

Esta sección está disponible solo para usuarios con suscripción. Por favor, mejora tu plan para acceder a esta parte.
Mejorar ahora


5.0 / 5 (0 votes)
