FA 50 - Horizontal Analysis

Tony Bell
26 Aug 201907:08

Summary

TLDRThis video script offers a detailed explanation of horizontal analysis in financial statement evaluation. It demonstrates how to compare two consecutive years to identify significant changes in a company's performance. The script illustrates the process by examining sales, cost of goods sold, gross profit, operating income, and other financial figures, highlighting the importance of year-over-year percentage changes for a more insightful analysis. The presenter emphasizes the need to investigate any discrepancies, such as a higher increase in cost of goods sold compared to sales, to understand underlying business dynamics.

Takeaways

  • 📘 The video discusses how to perform a horizontal analysis on financial statements by comparing one year to the next.
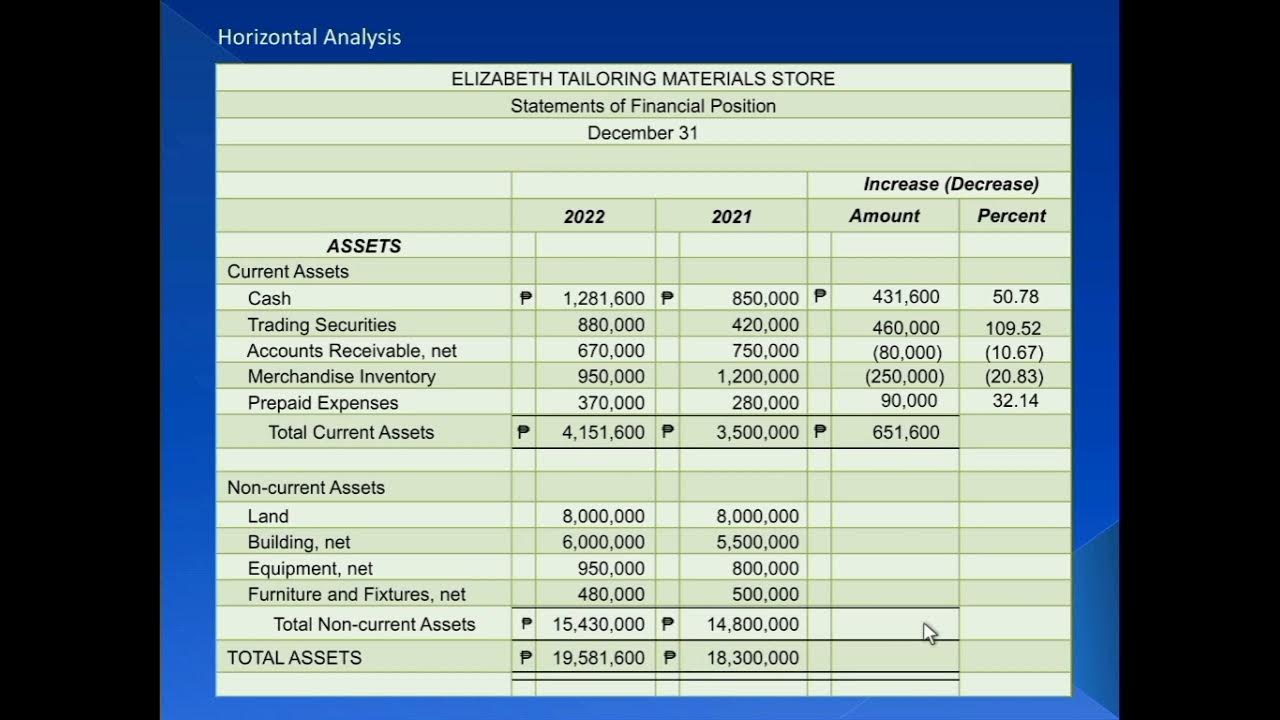
  • 📊 Horizontal analysis involves looking for significant changes in numbers between two consecutive years to understand the company's performance trends.
  • 🔍 The speaker emphasizes the importance of identifying big numbers with large changes as they can quickly reveal insights about a company's financial health.
  • 📈 The example given in the script shows a comparison of sales, cost of goods sold, gross profit, operating expenses, operating income, interest expense, income before tax, income taxes, and net income between 2023 and 2024.
  • 📉 The speaker points out that while most items increased, the interest expense decreased, which might be related to changes in long-term debt rather than operational performance.
  • 📊 Percentage change is highlighted as a more useful measure than absolute change, as it provides a relative comparison to the previous year's figures.
  • 🧮 To calculate the percentage change, the change in value is divided by the value of the earlier year, which gives a more meaningful insight into the company's growth or decline.
  • 🤔 The speaker suggests that comparing percentage changes can be more informative than absolute changes, especially when comparing companies of different sizes or in different industries.
  • 🚨 A key concern raised in the script is the cost of goods sold (COGS) increasing at a higher rate than sales, which could indicate a potential issue with pricing strategy or cost management.
  • 🔎 The speaker recommends investigating why COGS increased at a higher rate than sales, as this discrepancy could impact the company's profitability and margins.
  • 🔑 The takeaway emphasizes the importance of horizontal analysis as a fundamental tool for quickly understanding and evaluating a company's financial performance over time.

Q & A

  • What is the main focus of the video script?

    -The main focus of the video script is to explain the concept of horizontal analysis in the context of financial statements, using the example of a company's sales and other financial figures from two consecutive years.

  • Where can the workbook containing the problems discussed in the video be found?

    -The workbook can be found on a website mentioned in the script, where one can click the PDF link to download a copy of the problems.

  • What does the term 'horizontal analysis' refer to in the context of the video?

    -In the context of the video, 'horizontal analysis' refers to the process of comparing financial statements from one year to the next, to identify changes and trends in the company's financial performance.

  • How does the video script suggest identifying significant changes in financial statements?

    -The script suggests identifying significant changes by eyeballing the statements for big numbers with big changes, which can quickly tell a story about the company's financial performance.

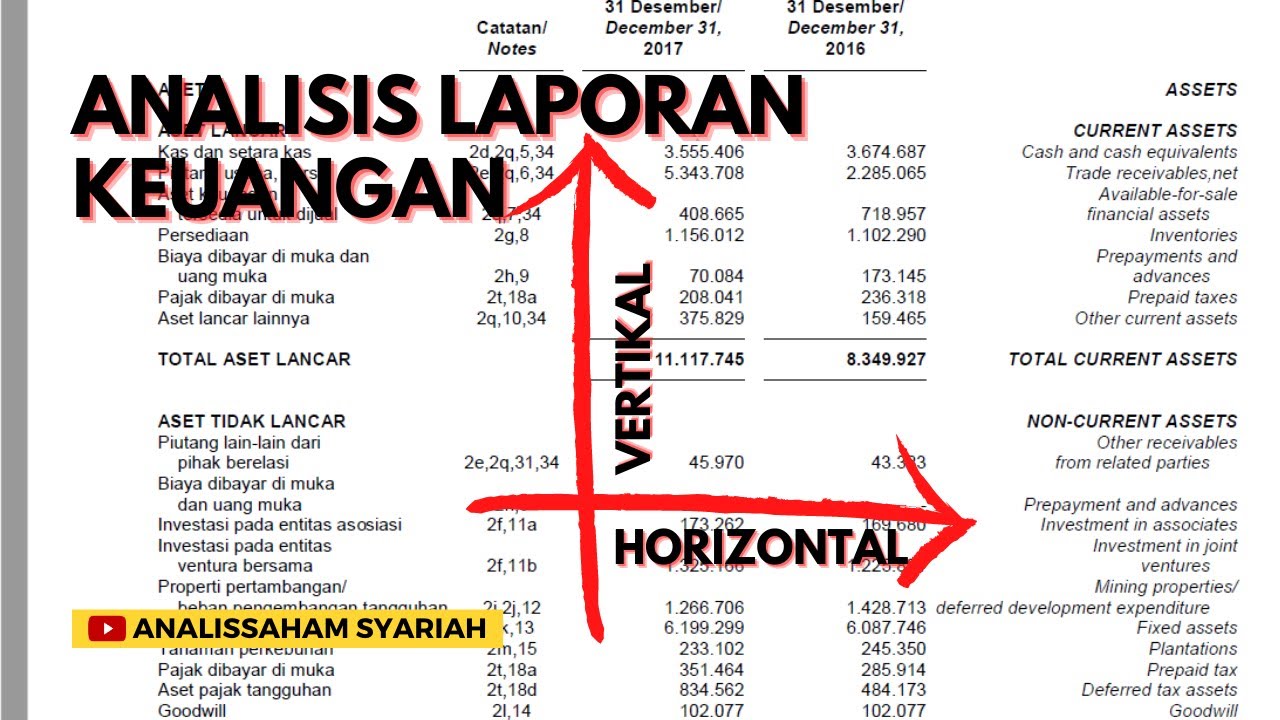
  • What is the difference between horizontal and vertical analysis in the context of financial statements?

    -Horizontal analysis involves comparing financial figures across different years to identify year-over-year changes, while vertical analysis compares figures within the same year to understand the proportionate relationship between different line items.

  • What is the significance of calculating percentage change in financial analysis?

    -Calculating percentage change is significant as it provides a relative measure of change, allowing for better comparison of performance across different time periods and between companies of varying sizes.

  • How does the video script define the year-over-year change in sales?

    -The year-over-year change in sales is defined as the difference in sales figures between two consecutive years, in this case, from 2023 to 2024.

  • What is the importance of comparing similar competitors when analyzing financial performance?

    -Comparing similar competitors is important to benchmark the company's performance against industry standards and to understand how effectively the company is performing relative to its peers.

  • Why might a company's cost of goods sold (COGS) increase at a higher rate than its sales?

    -A company's COGS might increase at a higher rate than its sales due to various factors such as increased production costs, higher input prices, or a change in the product mix that results in lower profit margins.

  • What does the video script suggest as the most concerning figure in the financial analysis presented?

    -The script suggests that the most concerning figure is the cost of goods sold (COGS) increasing at a higher rate than sales, which indicates a potential issue with profit margins and cost management.

  • How does the video script recommend further investigation of the financial figures?

    -The script recommends investigating the reasons behind significant changes, such as why COGS increased at a higher rate than sales, by examining factors like pricing strategies, cost management, and market conditions.

Outlines

00:00

📊 Horizontal Analysis of Financial Statements

This paragraph introduces the concept of horizontal analysis in financial statement evaluation. The speaker explains that horizontal analysis involves comparing one year's financial data to the next, rather than analyzing the components of a single year's statement. The example of the L key company is used to demonstrate how to identify year-over-year changes in sales, cost of goods sold, gross profit, operating expenses, operating income, interest expense, income before tax, income taxes, and net income. The speaker emphasizes the importance of looking at significant changes in numbers to quickly understand a company's performance. The paragraph concludes with a discussion on the usefulness of percentage changes in providing a more meaningful comparison, especially when comparing companies of different sizes or against industry peers.

05:02

🔍 Deep Dive into Cost of Goods Sold and Profitability

In this paragraph, the focus shifts to a more detailed examination of the cost of goods sold (COGS) and its impact on profitability. The speaker points out that while an increase in sales is positive, a disproportionate increase in COGS could indicate a problem. Using the L key company's data, the speaker calculates the percentage change in sales and COGS, noting that COGS increased at a higher rate than sales, which could be a concern. The speaker suggests that this discrepancy warrants further investigation, such as examining whether price reductions led to squeezed margins or if there were general cost increases. The paragraph also touches on the importance of comparing these figures with industry competitors to assess a company's performance relative to its peers.

Mindmap

Keywords

💡Horizontal Analysis

Horizontal analysis is a method of evaluating financial statements by comparing figures from one period to the next, typically year over year. It is fundamental in financial analysis, as it helps identify trends and changes in a company's financial performance. In the video, the concept is used to compare sales, cost of goods sold, and other financial figures between 2023 and 2024, highlighting the growth or decline in these areas.

💡Financial Statements

Financial statements are formal records of a company's financial activities, including the balance sheet, income statement, and cash flow statement. They provide a snapshot of the company's financial health and are essential for making informed business decisions. The video script discusses analyzing these statements horizontally to understand year-over-year changes.

💡Year-Over-Year (YOY)

Year-over-year refers to a comparison of data points from one year to the next. It is a common metric used to measure growth, decline, or stability in various financial metrics. In the script, YOY comparison is used to assess the change in sales, cost of goods sold, and other financial figures.

💡Sales

Sales represent the income generated from the company's primary operations, typically from selling goods or services. In the video, the script mentions a YOY increase in sales from $151,000 to $168,000, indicating a positive trend in the company's revenue.

💡Cost of Goods Sold (COGS)

Cost of goods sold is the direct costs attributable to the production of the goods sold by a company. It includes material and labor costs but excludes indirect costs like rent and utilities. The script points out an increase in COGS from one year to the next, which is a critical factor in analyzing the company's profitability.

💡Gross Profit

Gross profit is the profit a company makes after deducting the cost of goods sold from its sales revenue. It indicates how much profit is generated from the sales before considering other expenses. The video script shows an increase in gross profit, which is a key indicator of the company's operational efficiency.

💡Operating Expenses

Operating expenses are the costs incurred in the normal course of business operations, excluding cost of goods sold. They include salaries, rent, utilities, and other overheads. In the script, an increase in operating expenses is noted, which is essential for understanding the company's cost management.

💡Operating Income

Operating income, also known as operating profit, is the profit that remains after deducting operating expenses from gross profit. It is a measure of profitability that excludes non-operating income and expenses. The script mentions an increase in operating income, reflecting the company's ability to generate profit from its core operations.

💡Interest Expense

Interest expense is the cost a company incurs for borrowed money. It is an important item in the income statement, reflecting the financial cost of debt. The video script notes a decrease in interest expense, which could indicate improved debt management or lower borrowing costs.

💡Income Before Tax

Income before tax, also known as pre-tax income, is the profit a company earns before accounting for income taxes. It is a key measure of a company's financial performance before the impact of taxation. The script discusses an increase in income before tax, showing the company's profitability before taxes are considered.

💡Net Income

Net income, also known as the bottom line, is the profit that remains after all expenses, including taxes, have been deducted from sales. It is the final figure that reflects the company's overall profitability. In the script, an increase in net income is highlighted, indicating the company's success in generating earnings for its shareholders.

💡Percentage Change

Percentage change is a way to express the change in a quantity relative to its initial value. It is calculated by dividing the difference between the new and old values by the initial value and multiplying by 100. In the video, percentage changes are used to evaluate the YOY performance of various financial metrics, providing a clearer picture of the company's growth or decline.

Highlights

The video introduces a counting workbook available for download from a website.

There are more videos on the website than listed on YouTube, including both public and members-only content.

The workbook covers every problem with either a public or members-only video explanation.

Horizontal analysis is explained as comparing one year to the next in financial statements.

A hand gesture is used to illustrate the concept of horizontal analysis.

The importance of horizontal analysis in quickly understanding significant changes in a company's financials is emphasized.

Sales grew from $151,000 to $168,000, indicating a year-over-year increase.

The concept of percentage change is introduced to provide a more meaningful comparison.

Sales increased by 11.3% year-over-year, providing a clearer picture of growth.

Cost of goods sold (COGS) increased by 15.4%, which is a higher rate than sales growth.

Gross profit, operating expenses, and operating income all show an increase, but at varying percentages.

Interest expense decreased by 33%, which may be related to changes in long-term debt.

Income before tax, income taxes, and net income all show an increase, indicating overall financial health.

The importance of comparing percentage changes with industry peers is discussed for context.

A significant insight is that COGS increased at a higher rate than sales, which could impact profitability.

Investigating the reasons behind the higher rate of COGS increase compared to sales growth is suggested.

The video concludes with a call to action to stay tuned for the next video in the series.

Transcripts

play00:00

the problem from this video can be

play00:02

downloaded at a Counting workbook calm

play00:04

if you go to the website click the PDF

play00:06

link and you can download a copy of this

play00:09

and all of my problems for yourself now

play00:12

if you check the website and you click

play00:13

on videos you'll see there are more

play00:15

videos than those I've listed publicly

play00:18

on YouTube you can see that there's

play00:20

every problem covered in the workbook

play00:22

has either a public video or a

play00:24

members-only video if you'd like access

play00:27

to the members only video just click the

play00:29

join button beneath the video player on

play00:32

YouTube alright let's jump into the

play00:34

problem let's examine problem 12:1 a

play00:38

this has us doing a horizontal analysis

play00:41

now just wherever you are in your seat

play00:43

right now give me like a hand gesture

play00:45

for horizontal ok have you done it just

play00:49

with your hands show me what horizontal

play00:51

looks like horizontal looks like this

play00:54

doesn't it not like this not like

play00:56

up-and-down horizontal looks like kind

play00:59

of like that

play00:59

well horizontal analysis has us

play01:03

analyzing financial statements like this

play01:05

what does it mean well if we look at

play01:07

this L key company and look at its

play01:09

financial statements horizontal means

play01:11

were comparing one year to the next

play01:14

right we're comparing two years to each

play01:17

other we're not looking up and down the

play01:19

statement to compare o what's our sales

play01:21

versus our cost of goods sold no no

play01:22

we're comparing 2023 sales to 2024 sales

play01:26

this is so fundamental right when I

play01:30

analyze a company this is one of the

play01:32

first things I do just I eyeball it and

play01:33

I look for big numbers that had big

play01:36

changes so I'll look and I'll say oh you

play01:39

know what we're our year over your sales

play01:40

Oh our sales grew right you can just

play01:43

eyeball this and you can say Oh

play01:44

horizontally my sales grew from 151 to

play01:47

168

play01:48

they grew by $70,000 already I'm saying

play01:51

something intelligent I can do our sales

play01:53

were up $17,000 how much were they up

play01:55

the year before you know they were up

play01:57

50,000 a year before only 17 this year

play01:59

that's not great you already know

play02:01

something about the company very quickly

play02:03

right big numbers with big changes tell

play02:06

you a story about a company so that's

play02:08

what a horizontal analysis sets out to

play02:10

do and this is the most basic horizontal

play02:13

analysis

play02:13

I put a triangle there I'll put it in

play02:15

black ink triangle means change

play02:20

and so our year-over-year change here is

play02:23

all we want to do so 151 to 168 means

play02:26

it's a change of plus $17,000 right our

play02:30

sales are up $17,000 our cost of goods

play02:33

sold up 12,000 our gross profit up 5,000

play02:39

our operating expenses are up to our

play02:43

operating income up 3 our interest

play02:48

expense down a thousand our income

play02:51

before tax up 4,000 our income taxes are

play02:56

up a thousand and our net income is up

play03:00

3,000 so already we've kind of learned

play03:02

something right we've learned okay most

play03:04

things are up interest expenses down

play03:06

that might be related that is related to

play03:09

long-term debt more than any financial

play03:12

performance so the change is relevant

play03:15

but what's even more useful and you'll

play03:17

see this stated very commonly is the

play03:20

percentage change year over year so to

play03:24

compute a percentage change you just

play03:26

take that change number and divide by

play03:28

the earlier year so for example for my

play03:32

sales that change was 17,000 I'm gonna

play03:35

divide by the sales of the earlier year

play03:37

1 5 100 and I'm gonna say hey my sales

play03:42

are up eleven point two actually eleven

play03:46

point three

play03:47

I'm around in the wrong way here 11.3%

play03:51

my cost of goods sold 12,000 / 78 15.4%

play04:00

my gross profit 5 / 73 my gross profit

play04:05

is up 6.8% my operating expenses up 6.7%

play04:16

my operating income six point nine seven

play04:24

percent 7.0 percent I guess that rounds

play04:26

to

play04:27

my interest expense 1/3 it's down 33% 33

play04:37

and 1/3 4/4 t I can already tell you

play04:41

that that's up 10 point o % I didn't put

play04:44

pluses here but these are all

play04:46

up-up-up-up-up

play04:49

income taxes are also up 10% and our

play04:53

profits up 10% ok so again we can say

play04:58

something intelligent our sales are up

play05:00

11% that compares the last year sales

play05:02

which were increased by 20% you know you

play05:04

can compare things by percentages and

play05:08

again it's it's useful like saying you

play05:11

know if I told you my company sales are

play05:12

up $17,000 it doesn't mean much because

play05:14

you don't know the size of the company

play05:15

if I say oh my company's sales are up

play05:17

10% or 11.3% you get a better feel and

play05:20

you don't look at it in a vacuum I would

play05:23

say okay I'm looking at home depot or

play05:24

lowes you know there's very similar

play05:27

companies Home Depot sales were up 15%

play05:29

low sales were up by 9 percent well Home

play05:32

Depot outperformed Lowe's right where

play05:34

you know maybe Amazon sales were up 30%

play05:37

and they're just not comparable I would

play05:40

want to compare two similar competitors

play05:44

okay which items would I call out if I

play05:46

were if I were analyzing this company if

play05:48

I were the operator here I would be

play05:51

actually be most concerned with this one

play05:53

that would be the number I'd be calling

play05:56

out I'd say look sales are up 11% but

play05:58

cogs are up 15 we should have been way

play06:00

more profitable we generated 11% more

play06:05

sales but only 7% more gross profit and

play06:09

the reason was our costs were up why

play06:12

were our cost a bit slowed up did we

play06:13

have to reduce our prices and therefore

play06:15

our margins got squeezed was there where

play06:19

our costs just up generally maybe we

play06:21

should raise the prices what's going on

play06:23

that cogs was up at just a higher rate

play06:26

than everything else so that would be

play06:27

the number that I might investigate you

play06:30

might think well I should investigate

play06:31

the interest expense this wouldn't take

play06:33

much investigation I think you would

play06:35

look at the debt and you could see the

play06:36

terms of the debt were likely better or

play06:38

you just had less debt

play06:40

being serviced but do the alarming

play06:42

number from investor's standpoint or the

play06:45

number that you'd be worried about is

play06:46

that one cogs being up at a higher rate

play06:51

than ourselves we would expect you know

play06:52

you sell 10% more stuff guess what your

play06:54

cost of goods sold should go up by ten

play06:56

percent well we saw the 11 percent more

play06:57

stuff our cost of goods sold was up 15%

play06:59

this is significant and worth

play07:02

investigating ok that's it for this

play07:05

video stay tuned for the next one

Rate This

5.0 / 5 (0 votes)

Ähnliche Tags
Financial AnalysisHorizontal AnalysisYear-Over-YearSales GrowthCost of Goods SoldProfitabilityGross ProfitOperating ExpensesInterest ExpenseIncome TaxNet IncomeBusiness Insights
Benötigen Sie eine Zusammenfassung auf Englisch?