Lecture 3.2 - Describing Numerical Data - Mean
Summary
TLDRThe script discusses methods for calculating numerical summaries and measures of central tendency, such as the mean, for both ordinal and numerical data. It explains the concept of the mean as a central tendency and its importance in data analysis. The transcript also covers the calculation of the mean for sample and population data, and how to handle constant addition or multiplication to data sets, emphasizing the impact on the mean and its sensitivity to changes in individual data points.
Takeaways
- 📊 The script discusses the use of numerical summaries to describe data, focusing on the importance of central tendencies and measures of dispersion.
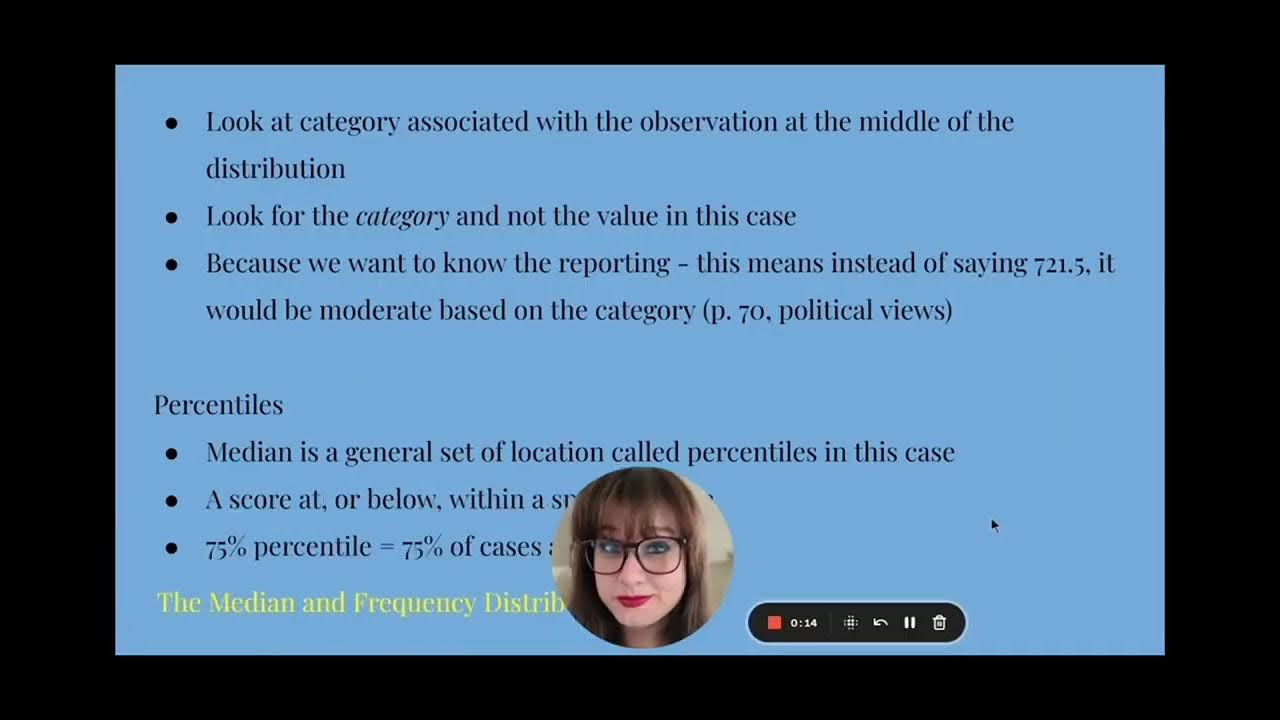
- 🔢 It explains the concept of 'Measures of Central Tendency', which includes the median and how it is calculated for ordinal data that may have an order but not specific numerical values.
- 📈 The concept of 'Measures of Dispersion' is introduced, discussing how it relates to the variability or spread within a dataset, and its significance in data analysis.
- 🌐 The script mentions 'Measures of Central Tendency' such as 'Mean', 'Mode', and their categorization, highlighting different approaches for numerical data.
- 📚 It introduces the term 'Measures of Dispersion', which includes 'Range' and 'Variance', explaining how they provide insights into the spread of data points around the mean.
- 📝 The importance of understanding both 'Measures of Central Tendency' and 'Measures of Dispersion' is emphasized for a comprehensive data summary.
- 🔍 The script provides examples of calculating the mean for both small and large datasets, illustrating how it serves as a representative value of the data.
- 📉 It discusses the impact of adding a constant to a dataset on the mean, explaining that the new mean will be the original mean plus the constant added.
- 📌 The script touches on the concept of 'Weighted Mean', where each data point is multiplied by a constant factor, and how it affects the overall mean.
- 📋 The difference between sample mean and population mean is clarified, with the sample mean being an estimate derived from a part of the population.
- 📘 Finally, the script emphasizes the practical applications of understanding these statistical measures in various fields, including education and research.
Q & A
What is the main topic discussed in the script?
-The main topic discussed in the script is the calculation and interpretation of numerical data summaries, particularly the mean (average) of data sets.
What are the two methods mentioned for summarizing data?
-The two methods mentioned for summarizing data are using the median and calculating the mean (average).
What is the median and how is it calculated?
-The median is the middle value in a data set when the numbers are arranged in ascending order. If there is an even number of observations, the median is the average of the two middle numbers.
How is the mean (average) of a data set calculated?
-The mean of a data set is calculated by summing all the values in the set and then dividing by the number of values.
What is the difference between a sample mean and a population mean?
-A sample mean is the average of a subset of data (sample) taken from a larger population, while a population mean is the average of the entire population.
What is the term 'Measures of Central Tendency' and what does it refer to?
-Measures of Central Tendency refer to the values that represent the center or typical value of a data set. The script specifically mentions the mean as a measure of central tendency.
How does adding a constant to each data point affect the mean?
-Adding a constant to each data point in a data set will increase the mean by the value of that constant.
What is the formula for calculating the mean when data is given in frequency distribution?
-The formula for calculating the mean in a frequency distribution is \( \bar{x} = \frac{\sum f_i \times x_i}{\sum f_i} \), where \( f_i \) is the frequency and \( x_i \) is the value of each data point.
How does multiplying each data point by a constant affect the mean?
-Multiplying each data point by a constant will scale the mean by that constant. For example, if each data point is multiplied by 2, the mean will also be doubled.
What is the difference between calculating the mean for discrete and continuous data?
-For discrete data, the mean is calculated by summing the products of each value and its frequency, divided by the total number of occurrences. For continuous data, the mean is often estimated by the midpoint of intervals, especially when dealing with grouped data.
Why is the mean sensitive to outliers in a data set?
-The mean is sensitive to outliers because extreme values can significantly skew the average, making it less representative of the central tendency of the data set.
Outlines

هذا القسم متوفر فقط للمشتركين. يرجى الترقية للوصول إلى هذه الميزة.
قم بالترقية الآنMindmap

هذا القسم متوفر فقط للمشتركين. يرجى الترقية للوصول إلى هذه الميزة.
قم بالترقية الآنKeywords

هذا القسم متوفر فقط للمشتركين. يرجى الترقية للوصول إلى هذه الميزة.
قم بالترقية الآنHighlights

هذا القسم متوفر فقط للمشتركين. يرجى الترقية للوصول إلى هذه الميزة.
قم بالترقية الآنTranscripts

هذا القسم متوفر فقط للمشتركين. يرجى الترقية للوصول إلى هذه الميزة.
قم بالترقية الآنتصفح المزيد من مقاطع الفيديو ذات الصلة

Mode, Median, Mean, Range, and Standard Deviation (1.3)
Ch 3 Lecture Video, Fall 2024: Measures of Central Tendency

ETC1000 Topic 2a

03. Cómo describir una variable numérica | Curso de SPSS

Central Tendency - Lecture

ଆସିଗଲା +2 Board Education Selection MCQ|+2 board 2026 education MCQ|Unit 4|Mcq|Unit 4|Plus two exam|
5.0 / 5 (0 votes)
