Candlestick para iniciantes - O que é e como interpretar
Summary
TLDRThis video introduces the basics and power of candlestick charts in financial trading. It explains their origin in 18th-century Japan for rice pricing and how they provide more insight than simple line or bar charts. Viewers learn how candlesticks reveal market psychology through elements like body, shadows, and color, allowing quick interpretation of buying and selling dynamics. The video covers key patterns such as Marubozu, Spinning Top, Hammer, and Doji, highlighting their role in identifying market trends and reversals. Practical tips are shared for applying candlestick analysis across various timeframes, emphasizing informed trading decisions.
Takeaways
- 📈 Candlestick charts originated in 18th century Japan as a way to graphically represent rice prices, and were later introduced to modern trading markets in the 20th century.
- 📊 Line charts are simpler and easier to read but provide less detailed information compared to candlestick charts.
- 🧠 Candlestick charts allow traders to understand market psychology and the behavior of buyers and sellers through visual patterns.
- 🔥 Technical indicators combined with candlestick patterns enhance a trader's ability to make informed decisions based on market conditions.
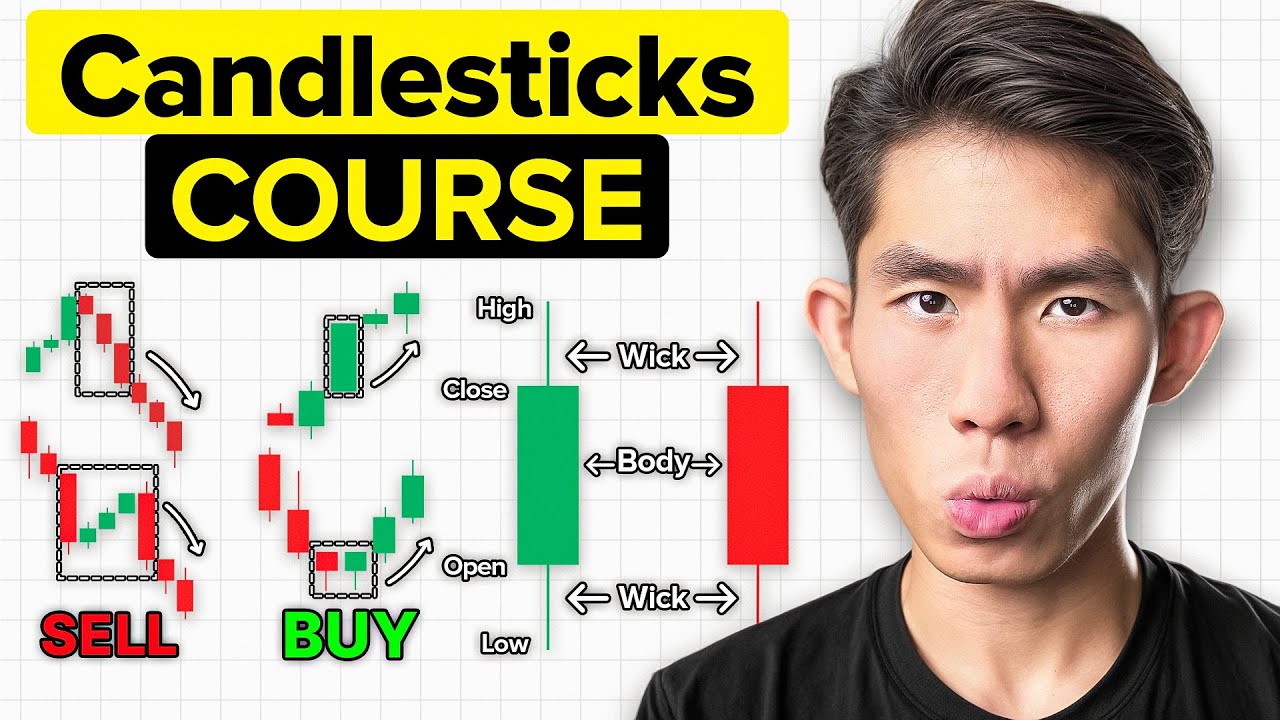
- 🔴 A red candlestick indicates a day of price decline, while a green candlestick indicates a day of price increase; some traders use alternative color schemes like black and white.
- 🌟 The 'body' of a candlestick represents the opening and closing prices, while the 'shadows' represent the highs and lows outside the body during the trading period.
- 💡 Candlestick patterns like Marubozu (no shadows) and Spinning Top (small body with long shadows) provide insights into market indecision or strong conviction.
- ⚖️ Some candlestick patterns require context, such as appearing within a trend, to confirm reversals or continuation signals (e.g., Hammer or Engulfing patterns).
- 📚 Learning and recognizing candlestick patterns allows traders to assess probabilities for future price movements and better plan their trades.
- 🎯 Candlestick charts can be applied to any time frame—from 1 minute to daily charts—and across any trading asset.
- 🔗 The video emphasizes additional resources, like playlists, to explore more candlestick patterns and deepen market analysis knowledge.
Q & A
What is the origin of candlestick charting?
-Candlestick charting was invented in the 18th century by a Japanese man named Homma, who used it to graph the price of rice. It wasn't until the 20th century that Western traders introduced the concept to the broader market.
Why are candlestick charts more useful than line charts?
-Candlestick charts provide additional layers of information compared to line charts. While line charts only show price movement over time, candlesticks also reveal market psychology, which can help traders understand the sentiment of buyers and sellers.
What can candlestick patterns reveal about market psychology?
-Candlestick patterns can suggest whether there is market indecision or conviction among buyers and sellers. For example, a long-bodied candlestick suggests strong conviction, while a small-bodied one with long shadows indicates uncertainty.
What is the key advantage of using candlestick charts for analysis?
-The key advantage of candlestick charts is that they provide a quicker visual representation of market behavior. Traders can instantly gauge the mood of the market, whether it's bullish, bearish, or neutral.
How are candlestick patterns used for decision-making?
-Candlestick patterns are used to predict future market movements. By identifying specific patterns, such as a hammer or an engulfing pattern, traders can assess the likelihood of a price reversal or continuation, improving their timing and decision-making.
What does the red and green color scheme of candlesticks represent?
-In candlestick charts, the color red typically indicates a day of decline (where the closing price is lower than the opening price), while green represents a day of increase (where the closing price is higher than the opening price). Some traders use black and white for the same purpose.
What do the shadows on a candlestick represent?
-The shadows (or wicks) of a candlestick represent the highest and lowest prices reached during a given period of time. The length of these shadows provides insight into the volatility and price rejection at specific levels.
What is the difference between a marubozu and a spinning top candlestick?
-A marubozu candlestick has no shadows, meaning it closed at its highest or lowest point, indicating strong market momentum. A spinning top, on the other hand, has a small body and long shadows, signifying indecision in the market.
Can candlestick patterns be used in all timeframes?
-Yes, the principles of candlestick patterns apply to any timeframe, whether it's a 1-minute, 5-minute, daily, or weekly chart. The patterns are scalable across different timeframes and assets, though their effectiveness may vary depending on the timeframe.
What is the significance of a hammer candlestick pattern?
-A hammer is a candlestick pattern that forms during a downtrend and has a small body with a long lower shadow. It suggests a potential reversal in the market, as it indicates that buyers are starting to gain control after a period of selling pressure.
Outlines

هذا القسم متوفر فقط للمشتركين. يرجى الترقية للوصول إلى هذه الميزة.
قم بالترقية الآنMindmap

هذا القسم متوفر فقط للمشتركين. يرجى الترقية للوصول إلى هذه الميزة.
قم بالترقية الآنKeywords

هذا القسم متوفر فقط للمشتركين. يرجى الترقية للوصول إلى هذه الميزة.
قم بالترقية الآنHighlights

هذا القسم متوفر فقط للمشتركين. يرجى الترقية للوصول إلى هذه الميزة.
قم بالترقية الآنTranscripts

هذا القسم متوفر فقط للمشتركين. يرجى الترقية للوصول إلى هذه الميزة.
قم بالترقية الآنتصفح المزيد من مقاطع الفيديو ذات الصلة

Boot Camp Day 2: Candlesticks

Technical Analysis For Beginners: Candlestick Trading Guide!

Road To Gloryy Day 1 : How to read a Forex Chart

The ONLY Candlestick Video You’ll EVER Need (Step By Step Guide)
ULTIMATE Candlestick Patterns Trading Guide *EXPERT INSTANTLY*

Jenis-jenis Chart Saham untuk Trading | feat. Michael Yeoh
5.0 / 5 (0 votes)
