Chapter 5 - Tutorial Analisa Data Part 3 (Pivot Table) | Informatika Booster
Summary
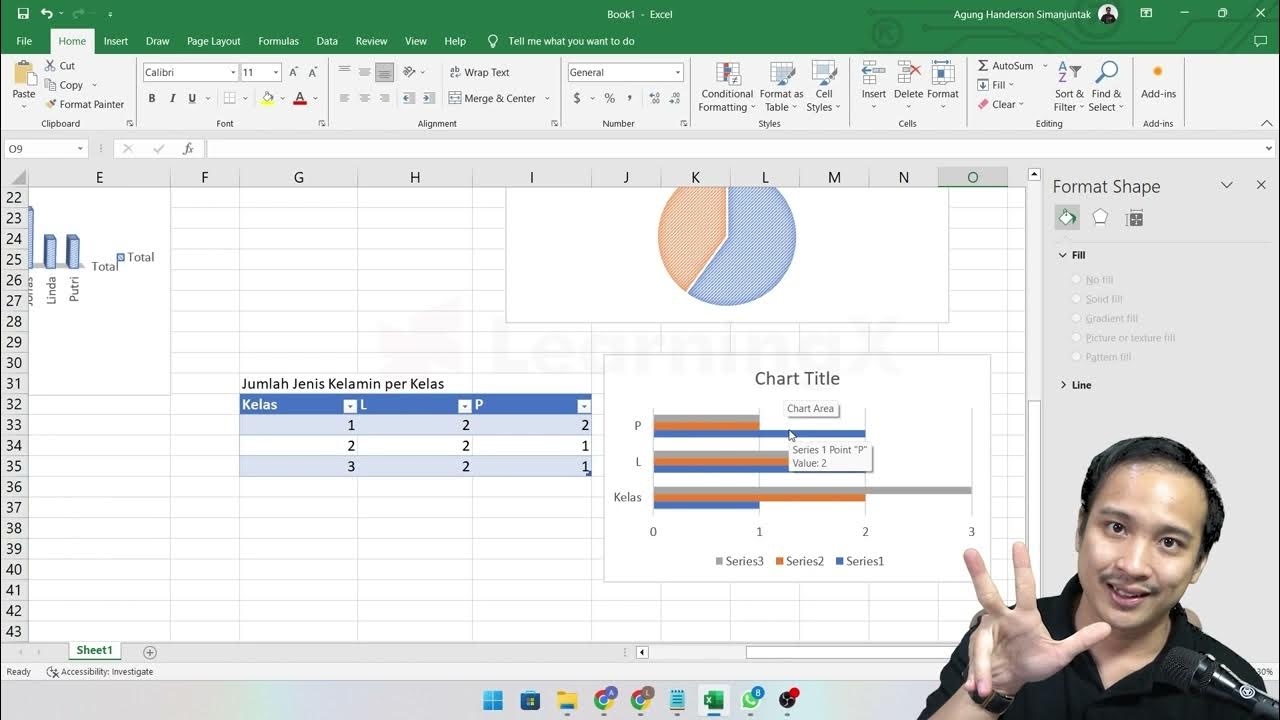
TLDRThis tutorial demonstrates how to work with pivot tables and charts in Microsoft Excel to simplify data analysis. The speaker explains step-by-step how to create pivot tables, organize data by rows, and remove unnecessary grand totals. It also covers using functions like COUNT, SUM, and IF for data calculations. The tutorial shows how to visualize data with various chart types, such as 3D column charts, and highlights Excel's tools for effective data presentation. The speaker encourages users to experiment with Excel's features to streamline their data analysis process.
Takeaways
- 😀 Pivot Tables in Excel simplify data analysis by automatically summarizing large datasets without manual calculation.
- 😀 To create a Pivot Table, first select your data, go to the Insert tab, and choose 'Pivot Table' from the options.
- 😀 When inserting a Pivot Table, you can either choose to place it in a new worksheet or an existing one to avoid unnecessary sheet creation.
- 😀 In the Pivot Table Field list, you can drag and drop fields into 'Rows' and 'Values' to arrange the data as needed.
- 😀 The 'Grand Total' field, by default, uses the SUM formula, but this can be removed by adjusting Pivot Table options.
- 😀 For accurate row counting, use the 'COUNT' function in place of the 'SUM' formula to count the number of entries in the data.
- 😀 Excel offers several useful functions for Pivot Table calculations, such as SUM, COUNTIF, COUNTIFS, and COUNT.
- 😀 Charts can be created from Pivot Tables to provide a visual representation of the data, making it easier to analyze patterns.
- 😀 When creating a chart, choose from various types (e.g., bar chart, column chart) and customize it for better visual appeal.
- 😀 Pivot Tables are a powerful tool for organizing and analyzing data quickly, reducing the need for manual data manipulation.
- 😀 It's essential to practice using Pivot Tables and charts to become proficient in Excel for data analysis and reporting.
Q & A
What is the first step when creating a Pivot Table in Excel?
-The first step is to select the data you want to analyze. Then, go to the 'Insert' tab and choose 'Pivot Table' to begin the process.
Why is it important to select an existing worksheet when creating a Pivot Table?
-Selecting an existing worksheet helps avoid creating unnecessary new sheets and keeps the data within the same workspace, making it easier to manage.
How can you remove the Grand Total in a Pivot Table?
-To remove the Grand Total, right-click on the Pivot Table, select 'Pivot Table Options,' and under the 'Totals and Filters' section, uncheck the Grand Total option.
What is the difference between the SUM and COUNT functions in Excel?
-The SUM function adds up numerical values in a selected range, whereas the COUNT function counts the number of rows or non-empty cells in a given range.
What function is recommended for counting the number of rows in a Pivot Table?
-The COUNT function is recommended to count the number of rows in a Pivot Table, as it counts the data rows, not the sum of the numbers.
What is the purpose of using Pivot Tables in Excel?
-Pivot Tables are used to easily analyze, summarize, and organize large datasets without needing complex manual calculations, helping to focus on specific data insights.
What type of chart is suggested for visualizing the data in the video?
-The video suggests using a 3D column chart for visualizing the data, as it provides a clear and aesthetically pleasing representation.
Can you modify the Pivot Table data directly in the chart?
-No, the data in the Pivot Table is linked to the source data, and any changes should be made in the original data. The chart simply displays the Pivot Table's results.
What does the 'COUNTIF' function do in Excel?
-The 'COUNTIF' function counts the number of cells that meet a specific condition or criteria within a given range.
What are the advantages of using Pivot Tables over manually analyzing data in Excel?
-Pivot Tables allow for quick, dynamic data analysis and summarization, reducing the need for complex formulas and manual data manipulation, making the analysis process more efficient and accurate.
Outlines

هذا القسم متوفر فقط للمشتركين. يرجى الترقية للوصول إلى هذه الميزة.
قم بالترقية الآنMindmap

هذا القسم متوفر فقط للمشتركين. يرجى الترقية للوصول إلى هذه الميزة.
قم بالترقية الآنKeywords

هذا القسم متوفر فقط للمشتركين. يرجى الترقية للوصول إلى هذه الميزة.
قم بالترقية الآنHighlights

هذا القسم متوفر فقط للمشتركين. يرجى الترقية للوصول إلى هذه الميزة.
قم بالترقية الآنTranscripts

هذا القسم متوفر فقط للمشتركين. يرجى الترقية للوصول إلى هذه الميزة.
قم بالترقية الآنتصفح المزيد من مقاطع الفيديو ذات الصلة

📊 How to Build Excel Interactive Dashboards

Cross Filter and Highlight Excel Charts like Power BI

Chapter 5 - Analisa Data melalui Excel | Informatika Booster

Learn Excel Pivot Tables in 10 Minutes - A complete beginner's tutorial

Pivot Tables in Excel | Excel Tutorials for Beginners

Learn 80% of Data Analysis in Excel in Just 12 Minutes
5.0 / 5 (0 votes)
