How to Use Fibonacci Retracement in Tradingview ✔️ Draw FIBONACCI Correctly ✏️ Golden Zone Settings
Summary
TLDRThis video tutorial guides viewers on how to add Fibonacci retracement to a chart on TradingView. It explains the process of identifying a swing and a retracement to draw the Fibonacci levels correctly. The video emphasizes the significance of the 'Golden Zone' between 0.382 and 0.618 levels, often where price reversals occur. It also demonstrates how to customize the Fibonacci settings to focus on these key levels, enhancing the viewer's understanding of chart analysis in trading.
Takeaways
- 📈 To add Fibonacci retracement to TradingView, start by opening a chart and navigating to the 'Super Charts' option.
- 🛠️ Access the Fibonacci tools by clicking on the 'Gann and Fibonacci' tools in the upper left corner of the chart.
- 🔍 To draw Fibonacci levels, identify a strong price swing and a retracement in the opposite direction.
- 📍 Begin the Fibonacci retracement from the lowest point of the swing and drag it to the highest point.
- 🌟 The most crucial Fibonacci zone, known as the 'Golden Zone', lies between the 0.382 and 0.618 levels.
- ⚙️ To customize the Fibonacci settings, click on the tool and navigate to the 'Settings' tab to adjust the levels displayed.
- 🛑 Many traders disable all levels except for 0, 0.382, and 0.618 to focus on the most significant areas.
- 🎨 The speaker suggests personalizing the color coding by changing 0.618 to 'Golden' and 0.382 to 'Gray'.
- 👨🏫 For further education on TradingView, the speaker offers an extensive course on YouTube covering all aspects of the platform.
- 💡 The video script serves as a tutorial for using Fibonacci retracement in TradingView, emphasizing the importance of the 'Golden Zone'.
Q & A
How do you add Fibonacci retracement to a chart on TradingView?
-To add Fibonacci retracement to a chart on TradingView, you first open the chart, navigate to 'Product', then press 'Super Charts'. Next, go to the upper left corner and press 'Gann and Fibonacci' tools, and finally select 'FIB retracement'.
What is a swing in the context of Fibonacci retracement?
-A swing is a strong move either up or down in the market, which is used as a reference point for drawing Fibonacci retracement levels.
What is a retracement in the context of Fibonacci retracement?
-A retracement is a move in the market that goes in the opposite direction of the swing, and it's used to identify the start and end points for drawing the Fibonacci retracement levels.
How do you correctly draw Fibonacci levels on a chart?
-To draw Fibonacci levels correctly, you start from the lowest point of the swing and drag it up to the highest point of the swing.
What is the most important Fibonacci zone according to the script?
-The most important Fibonacci zone is between the 0.382 and 0.618 levels, which is often referred to as the 'Golden Zone'.
Why is the zone between 0.382 and 0.618 called the 'Golden Zone'?
-This zone is called the 'Golden Zone' because it is where the price often reverses, making it a significant area for potential market turns.
How can you change the settings of the Fibonacci retracement on TradingView?
-To change the settings, you press on the Fibonacci tool, navigate to the 'Settings' tab, and adjust the levels as desired.
What are some common settings adjustments traders make for the Fibonacci retracement?
-Many traders disable all levels except for 0, 0.382, and 0.618, and some change the color of the 0.618 to 'Golden' and the 0.382 to 'gray' for better visibility.
How can you disable all Fibonacci levels except for 0, 0.382, and 0.618 on TradingView?
-In the 'Settings' tab of the Fibonacci tool, you can disable all other levels and only enable 0, 0.382, and 0.618 by toggling the switches next to each level.
What additional resource is mentioned for learning more about TradingView?
-The script mentions a long TradingView course on YouTube that covers everything needed to know about using TradingView.
What are Gann and Fibonacci tools in TradingView?
-Gann and Fibonacci tools in TradingView are technical analysis tools used for chart pattern recognition and retracement level drawing, respectively.
Outlines

此内容仅限付费用户访问。 请升级后访问。
立即升级Mindmap

此内容仅限付费用户访问。 请升级后访问。
立即升级Keywords

此内容仅限付费用户访问。 请升级后访问。
立即升级Highlights

此内容仅限付费用户访问。 请升级后访问。
立即升级Transcripts

此内容仅限付费用户访问。 请升级后访问。
立即升级浏览更多相关视频

ICT OTE Explained Step by Step

PROFIT $100/HARI SCALPING PAKAI FIBONACCI (MASTER FIBONACCI)
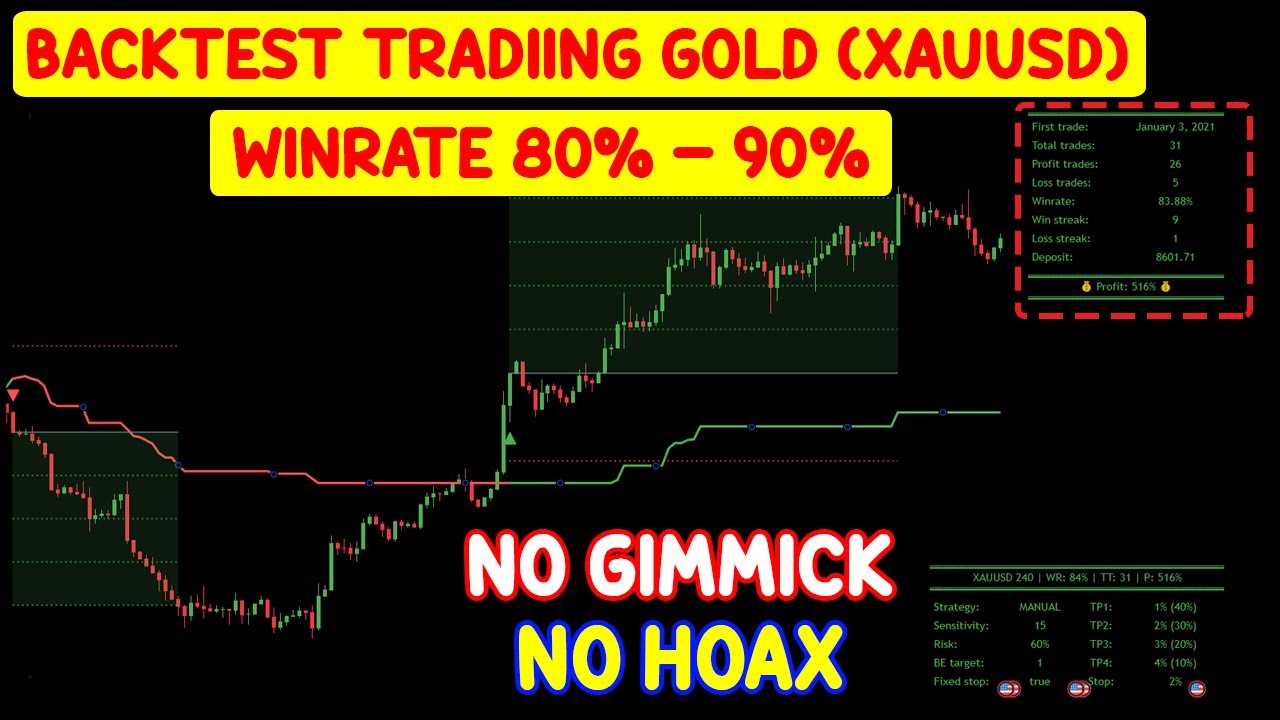
Backtest Trading Gold (XAUUSD) Winrate 80% - 90% No Gimmick & No Hoax | Swing Trading | Day Trading

How to Use Fibonacci Time Zones to Predict Price Movements?

Como hacer OPCIONES BINARIAS para PRINCIPIANTES

How to use Elliott Wave with Fibonacci
5.0 / 5 (0 votes)
